[documentation] RNN-stocks-prediction
Another attempt to use Deep-Learning in financial markets*
project mission: implement some AI systems described in research papers in a full-stack application deployed to the market.
* this web page is left without proper formatting on purpose
Recently I have been playing around with AI and Deep-Learning and I came out with this idea about DL applied to financial markets. Turns out that there are PLENTY of people already doing that out-there, here is a non-comprehensive list:
- 'deep-learning-the-stock-market', Tal Perry
- 'LSTM-Neural-Network-for-Time-Series-Prediction', Aungiers
- 'Recurrent neural networks approach to the financial forecast of Google assets', Di Persio, Honchar, 2017
- 'Artificial neural networks apporach to the forecast of stock market price movements', Di Persio, Honchar, 2016
After an intensive summer-school about DL and intensive reading of papers about the topic I decided to start my own project: here we are.
INDEX (kind of)
- Day 1 - kickstarting with regression
- Day 2 - classification time
- Day 3 - A deep unexpected model
- Day 4 - Balance the time
- Day 5 - the FOREX way
- Day 6 - going BIG
- Day 7 - Buliding an algorithmic trading software
- Day 8 - Binary to Ternary
- Day 9 - Ternary's side effects
- Day 14 - the first week of algo trading with my CNN (v.0.4.0 )
- Day 21 - Portabilty issues and web-app
- Last Day - Results and Future
-----------------------------------------
Day 1 - kickstarting with regression
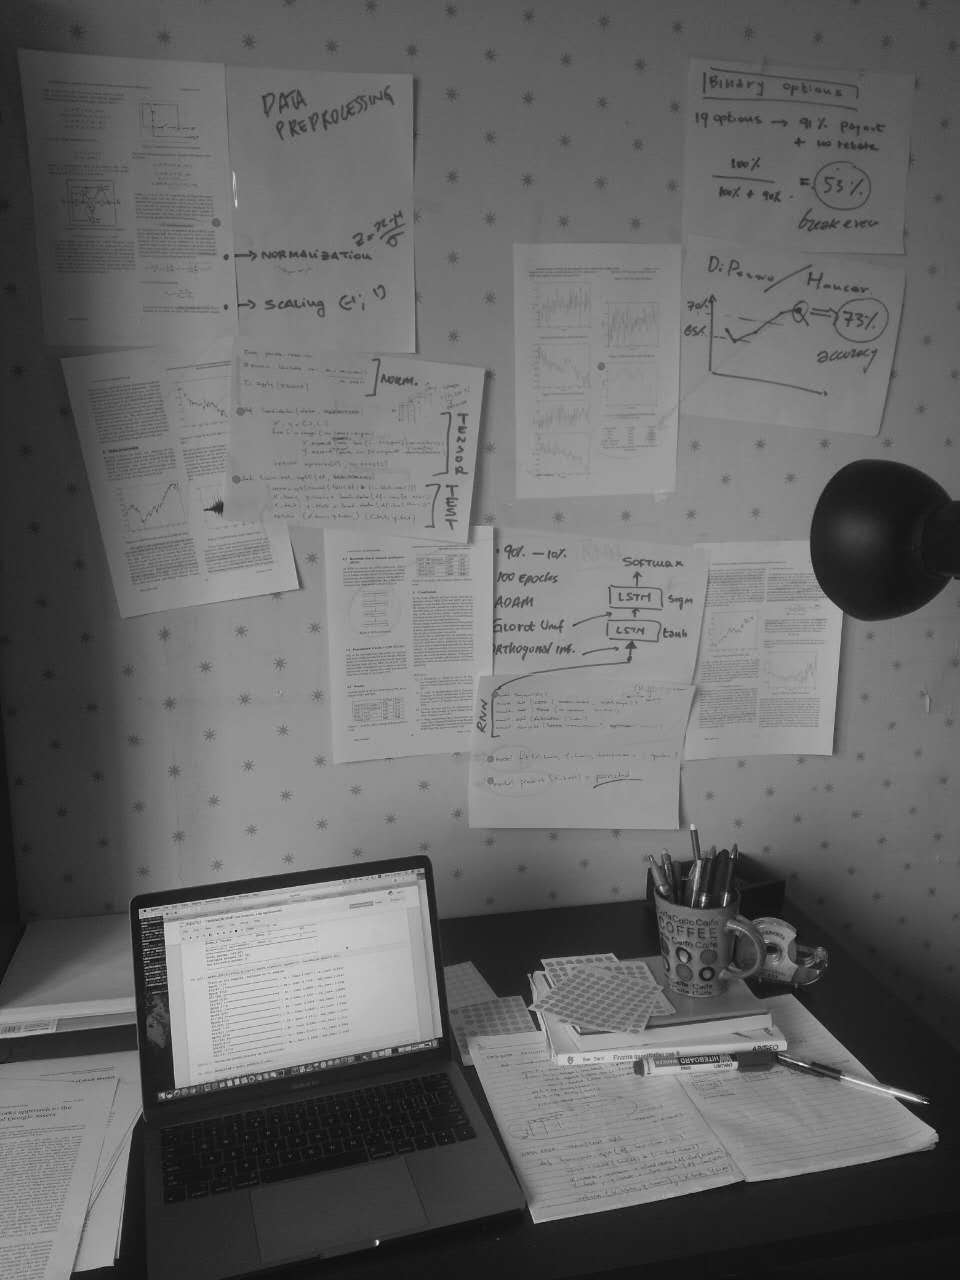
This is my work-desk on Day1. So after extensive reading of already existing implementation on the web about RNN to fin markets I am bit disappointed. Most of the time people have no idea what they are speaking about either because they don't know anything about finance or because they don't know anything about the foundation of Deep Learning (or both). On the other hand, what excites me most is that there are plenty of papers about people claiming to predict stock prices with accuracy from 65% to 80%, that is impressive. So my guideline is to try to implement those RNN models in my application, and apply the prediction to some financial instruments. Currently I would go for binary options, it seems fitting pretty well with the RNN prediction capabilities. There are two main types of approach to the problem:
- (A) Regression problem: the most straightforward, given the last Ndays predict tomorrow closing price.
- (B) Classification problem: given the last Ndays, will the price tomorrow goes up or down? (binary classification).
Full of example of (A) on the internet, and the truth it that they don't work so well. Anyway since they are relatively easy to impelement I gave it a try and here is the outcome.
This is graph is the normalized closing price of GOOGL(on a 30periods window), with actual and predicted. I trained the NN with 4 years of prices and 10 epochs.
So the graph is showing 'acutal' as the target price and 'predicted' as the price that the NN predicts. How does it work? Is really simple.
- use Pandas to download and create a DataFrame with OHLCV data
- create the tensor of dimensions (Batch_Size, 30, 5), so 30 time steps and 5 features
- split train and test data
- build the RNN model with Keras: I used LSTM + Dropout, a really simple implementation
- train the model,used 100 batch_size and 10 epochs
- predict the outcome from X_Test and compare the prediction with actual values
The full code of this implementation is in the repo regression.py
So the predictions are really bad, why is that? Of course the NN had not enough training data and the model is quite too simple: the papers suggest to implement at least two stacked LSTM layers with dropout and everything. Regarding the data (now the NN is trained only on GOOGL prices from 2012 to 2016) I should give the NN at least 20/30years of stock prices to acquire some consistency in the predictions. Anyway, this first example was interesting as shows that the NN is actually working an able to detect the trend in stock prices, even if not ready to do any useful prediction right now.
Same as above but this time the NN is trained with 16 years of stock prices, what is happening here is that the NN just take yesterday price and change a bit the value with no big difference. Thisresult is actually really bad from a prediction point of view, but is often misjudged as 'excellent' by people using Keras for the first time thinking that the NN is predicting the future: well, is not. Is just copying yesterday price.
The problem with regression is that the NN is not actually learning any pattern in the market, is just saying 'tomorrow price is the same as yesterday'. I found literally dozens of online courses and similar where they don't really understand what's going on and think that the NN is actually predicting with 100% accuracy the price of tomorrow, last graph below for regression problem, I trained the NN with 20years of data using a more complex model but the outcome doesn't change.
Regression or Classification? I would stop here improving the regression model (A) and spend my energy for the classification model (B). Why is that? In my opinion regression model is not the answer, as the OHLCV data are not enough for this kind of prediction. If we really want to predict the stock price consistently we need some sentiment analysis and other interesting things in our model, furthermore there is the accuracy question: if I am predicting the price I need a really high accuracy to implement it in a trading system or something. On the otherside, the classification problem woulde be extremely useful even if solved with a 60-70% accuracy. Why is that? I am thinking about some trading strategy with binary options. For now suffice it to say that if I am really able to solve the classification problem with something like 68% accuracy I am done: binary options have a break even of 53% and implementing an algo trading on that shouldn't be so difficult. Let's see what's next
Day 2 - classification time
BIGNEWS: I managed to speak with a PhD in DeepLearning from Tsinghua-Uni and we will have lunch sat, hope he will gives me great insight on what I am doing right/wrong.
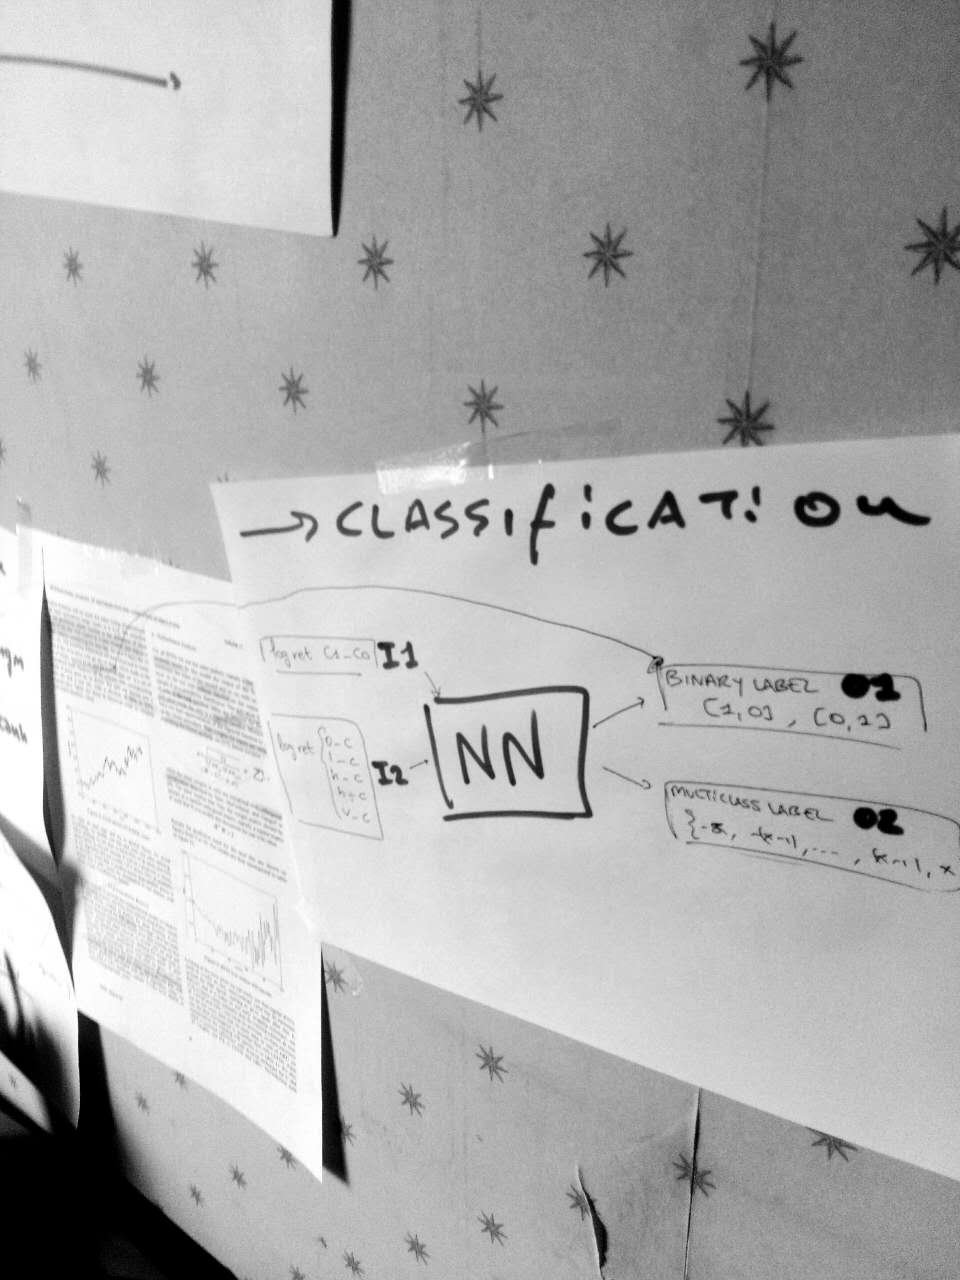
As I said, today I will focus on classification problem. So how does it work? This is my view up to now.
- INPUT - 30-days window normalized log-returns: a log return is defined with a function like this 'ret = lambda x,y: log(y/x)', and the returns must be normalized with a funct like this 'zscore = lambda x:(x -x.mean())/x.std()'. Easy stuff. The not-so-easy stuff here is whether to consider all the returns on OHLCV (option I2) or only the returns on Close prices (option I1). I will consider and try both options: I2 means considering much more info (5 features in the NN) about the financial asset that could not be so relevant, instead I1 is about just using closing prices (1 feature implementation) that should be more straightforward for humans. I will try both options and see how the NN react. This time we will have an accuracy value to tell us some detailed info about the performance of our dear NN.
- OUTPUT - label for tomorrow behaviour of (closing)price: also here we have a couple of choice to make, the first choice (option O1) is about a binary classification in the label, i.e. a binary vector [1,0] or [0,1] to show if the price goes up or down. The second choice (option O2) is implementing a multi-class classification, that could be understood as a "discrete mapping" from the continuous log return interval [-INF; +INF] to a discrete interval {-5, -4, .. , 4, 5}. As before, O2 is more difficult to implement and carry out more information, I will have a try with both and see the different outcomes.
After a few hours of testing and reading some papers about this topic I figured out that really good accuracy is obtained with the tuple I2-O1, that is multivariate input of all the OLHCV data and as output a binary classification [1,0] or [0,1] (not multi-class) of the predicted behaviour of the price. I will go for that one, as my next framework implementation.
- ATTENTION: IMMINENT BREAKTHROUGH -
So I wrote the Neural Network with I2-O1 configuration and the results were suprisingly good, on the training data of GOOGL stock price from 2000-2016 the NN got a prediction accuracy of 63%. What does it mean? That if you gave the last 30 days OHLCV prices from Yahoo Finance to the Neural Network it will be predict the price of tomorrow with an accuracy of 63% (right 63 times on 100). This is a great news since it mean that the NN is actually working and acquiring some prediction capabilities. Still, the validation accuracy is between 52-54%, so there is a large room for improvement. Here is the training accuracy and validation accuracy for the model.
Right now I am pretty positive, since the project is becoming meaningful. I am actually creating something that is able to predict prices consistently and improves during the training. This concept of 'training' the Neural Network really excites me, I mean seeing actually the NN getting better and better at predicting stock prices during the training. To highlight this concept I show you here the 'loss function', that is the difference between the predicted and actual value. As you see, during the training the loss is decreasing more and more (wow!). Of course, the model is not perfect and is still overfitting (as you can see is getting better and better on training data while worse on new validation data), how to avoid overfitting? Increase dropout, reduce complexity.. mmm actually the NN just needs more data. We will try to do that afterward.
PLOT TWIST: I DID NOT USE RNN
Yeah I didn't use a recurrent neural network model, no LSTM, no GRU, nothing. I used.. CNN! I found on this paper [Di Persio, Honchar 2017] the description of this Convolutional Neural Network model suitable for my O1-I2 model and it just worked perfectly. I will go thourgh the model implementation later, now I want to do a better training to actually see what this NN can do. So the next steps should be something like this:
- Prepare a massive training, using a full-index data like S&P500, I need to write some function to iterate over different tickers training the same model. This way I hope to get a first enhancement in the accuracy
- Analyise the CNN model, try to do some fine-tuning changing hyper-parameters and other features
- Implement the same structure with a RNN model, it should technically perform better
- If I get a decent accuracy (60%) also on the validation sample I can start to do some algo-trading benchmarking to evaluate the next steps
After this long day we got some result: EUREKA. Now will start the long journey to improve the accuracy as high as possible. I will probably spend the next hours playing around with the classification model on different financial instruments to see if I get some golden nugget (FOREX, Volatility and others)
Day 3 - A deep unexpected model
I am starting my third day of work on this project quite positive, after the GOOGL training set yesterday I tried to train the CNN on larger dataset and I got even better result. But let's go through the CNN Model to understand how it work.
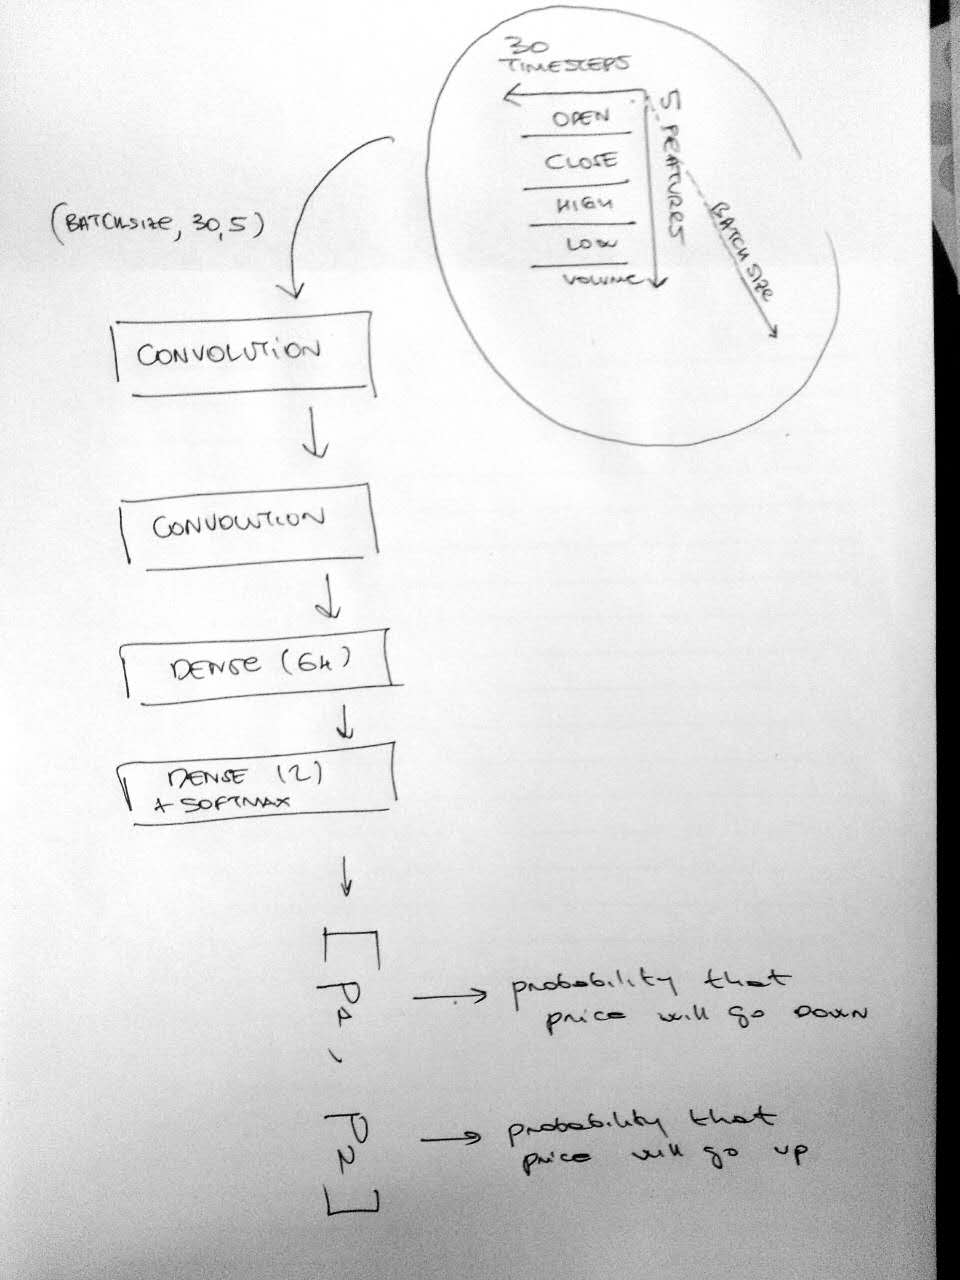
- INPUT Dataframe structure: the input data of the model is a tensor of shape (BATCH_SIZE, 30, 5), BATCH_SIZE is the length of our training data, 30 (Days) is the window size of prices that are 'looked backward' and 5 is the number of features (Open,High,Low,Close,Volume) [see my choice of I2 above]. Since we are choosing windows of 30days we are normalizing the 5 features with a zscore function on these 30 days.
- OUTPUT Dataframe structure: the output data model is a binary vector [1,0] or [0,1] [see my choice O1 above]. This is simply a vector with two components [p1, p2], where p1 is the probability of the price moving down and p2 is the probability of the price moving up. (yes, always p1+p2=1)
- Data splitting (train/test): after the dataframe is created the data are splitted between training part and testing part with 9:1 proportion. Currently the dataframe (with different stocks) is simply split with 9:1 proportion on the whole data set, not stock by stock.
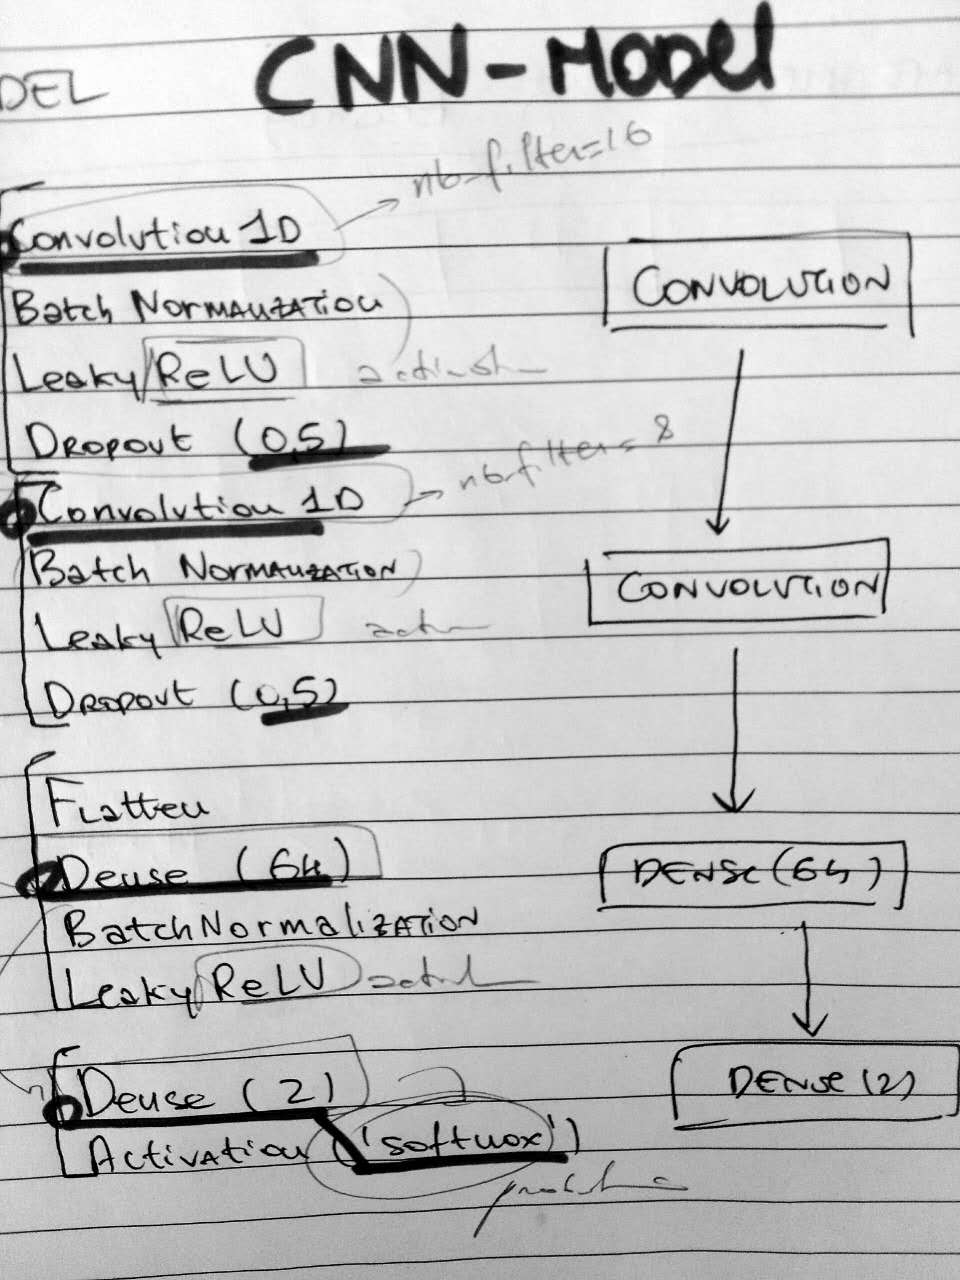
- Model (part 1): the first part of the CNN model is composed by two hidden convolutional layers (Conv1D) that take the INPUT Dataframe and identify the 'patterns' that cause the price movements (protip: check Convolution on Wikipedia)
- Model (part 2): the second part of the CNN is two dense layers + softmax activation that 'reduce' the data to a binary vector [p1, p2]
- Prediction: so after the model is trained for every input (30, 5) we get an output [p1, p2]. If p1>p2 the prediction is that price will go down, p2>p1 the price will go up.
The model right now is still quite simple and there are dozens of different implementations and variations that can be tried. My view up to now is that the key point is find the right balance with the kind of data to predict and the right complexity of the Neural Network. Here below is a scheme about the structure of the implementation up to now.
Ok so we have this model, to see how it actually perform with a large scale dataset I tried to run it on the SP500. Since I don't have any supercomputer around I just tried with my MacBook GPU on the first 15 titles of the SP500, namely ['ABT', 'ABBV', 'ACN', 'ADBE', 'AAP', 'AES', 'AET', 'AFL', 'AMG', 'A', 'GAS', 'APD', 'ARG'] -> about 40000 entries in the dataframe. I got different results from the previous GOOGL training set (4000 entries), let's have a look.
training dataset 15 titles from SP500, 110 epochs with a BATCH_SIZE of about 40000 entries, the final effective accuracy is about 54-55%
training dataset 15 titles from SP500, 110 epochs with a BATCH_SIZE of about 40000 entries, this time the loss is decreasing, not so much but is decreasing at least. So we DO NOT have overfitting
So having a look in hindsight about the performance of the NN on the GOOGL training data, the main problem is overfitting. In that case the loss function for the training dataset is decreasing while the loss function for validation data is increasing. This means that the NN while is learning really good the distribution of GOOGL prices but not really improving its prediction ability (about 52% for GOOGL validation data). Now on the SP500 dataset we have a substantial improvement on this. You can see that the loss value is actually decreasing BOTH for the training and validation: the predictivity of the NN is improving and the final result is in fact 54-55% predictivity on the actual validation set. Yes, now we are going towards underfitting and this is why we will need to take a look at our architecture and start to tune it to get better performance, but.. hey, now is really working. We are predicting on 55% accuracy new data. You can have a try to predict your own data loading my NN that you can find in .hfd5 format in the github repo here.
.Note: how did I extend the training from one stock to a full index? I wrote a small framework that basically iterate the data preprocessing I used with google with a larger dataframe that operate with different tickers, probably this framework will be the foundation of the full-stack application
What's next now? according to what I wrote yesterday and how my perspective is evolving I see two ways I can procede from now, both equally promising.
- The way of the BALANCE: the way to improve prediction capability is to find the right balance between the complexity of the data (using different timeframes, or adding more indicators and features) and the complexity of the architecture (how many layers, activation and error function). To quote the dear J. Bengio, 'tuning a NN is an art': it requires a good expertise in the field, so I consider quite challenging and exciting as a choice. Probably will lead to the best results.
- The way of the CHANGE: the other way is to change the CNN architecture to a different one, based on my readings I would say that other promising DNN arch. are RNN(LSTM), RNN(GRU), RNN(LSTM+Wavelet), RNN(GRU+Wavelet) and RNN(ELSM). Changing an architecture just means use a different implementation in the model, and thank to the AMAZING Francois that created this amazing tool called Keras, is pretty easy to implement different architecture. Hence, I would consider this way as the most straightforward but could reveals other breakthrough during the way.
- ATTENTION: IMMINENT BREAKTHROUGH -
So I started with 'the way of the Balance', because I wanted to have a better understanding of the data I am working on: I started playing around with different timeframes and different combination of inputs and after some trials I got an impressive improvement in the performance of my CNN. We all know how scientific progress is usually all about luck, and even in this case of course I had some luck in finding this pattern just after a couple of hours; but as a personal disclosure I would say that I had a kind of intuition on that. Let me briefly go through my mental process.
INTUITION: so the CNN is not working SO good on 1 day forecast, and this is due to a high noise and random motion in stock prices on a short term. The CNN should be good at individuating some 'patterns' that regulate stocks prices movement and to improve the performance I should try to find a situation where this pattern are more evident without all that noise from daily prices and Random/Brownian motion. Let's see, what if I increase the time frame? If I tell my CNN not to predict tomorrow prices but to predict next week price I should be able to take away most of the noise and actually spot those valuable patterns I am looking for. Long-story-short it works, the CNN improves from a 53% to a 57% prediction accuracy on new data. Let's see the CNN in action during the training.
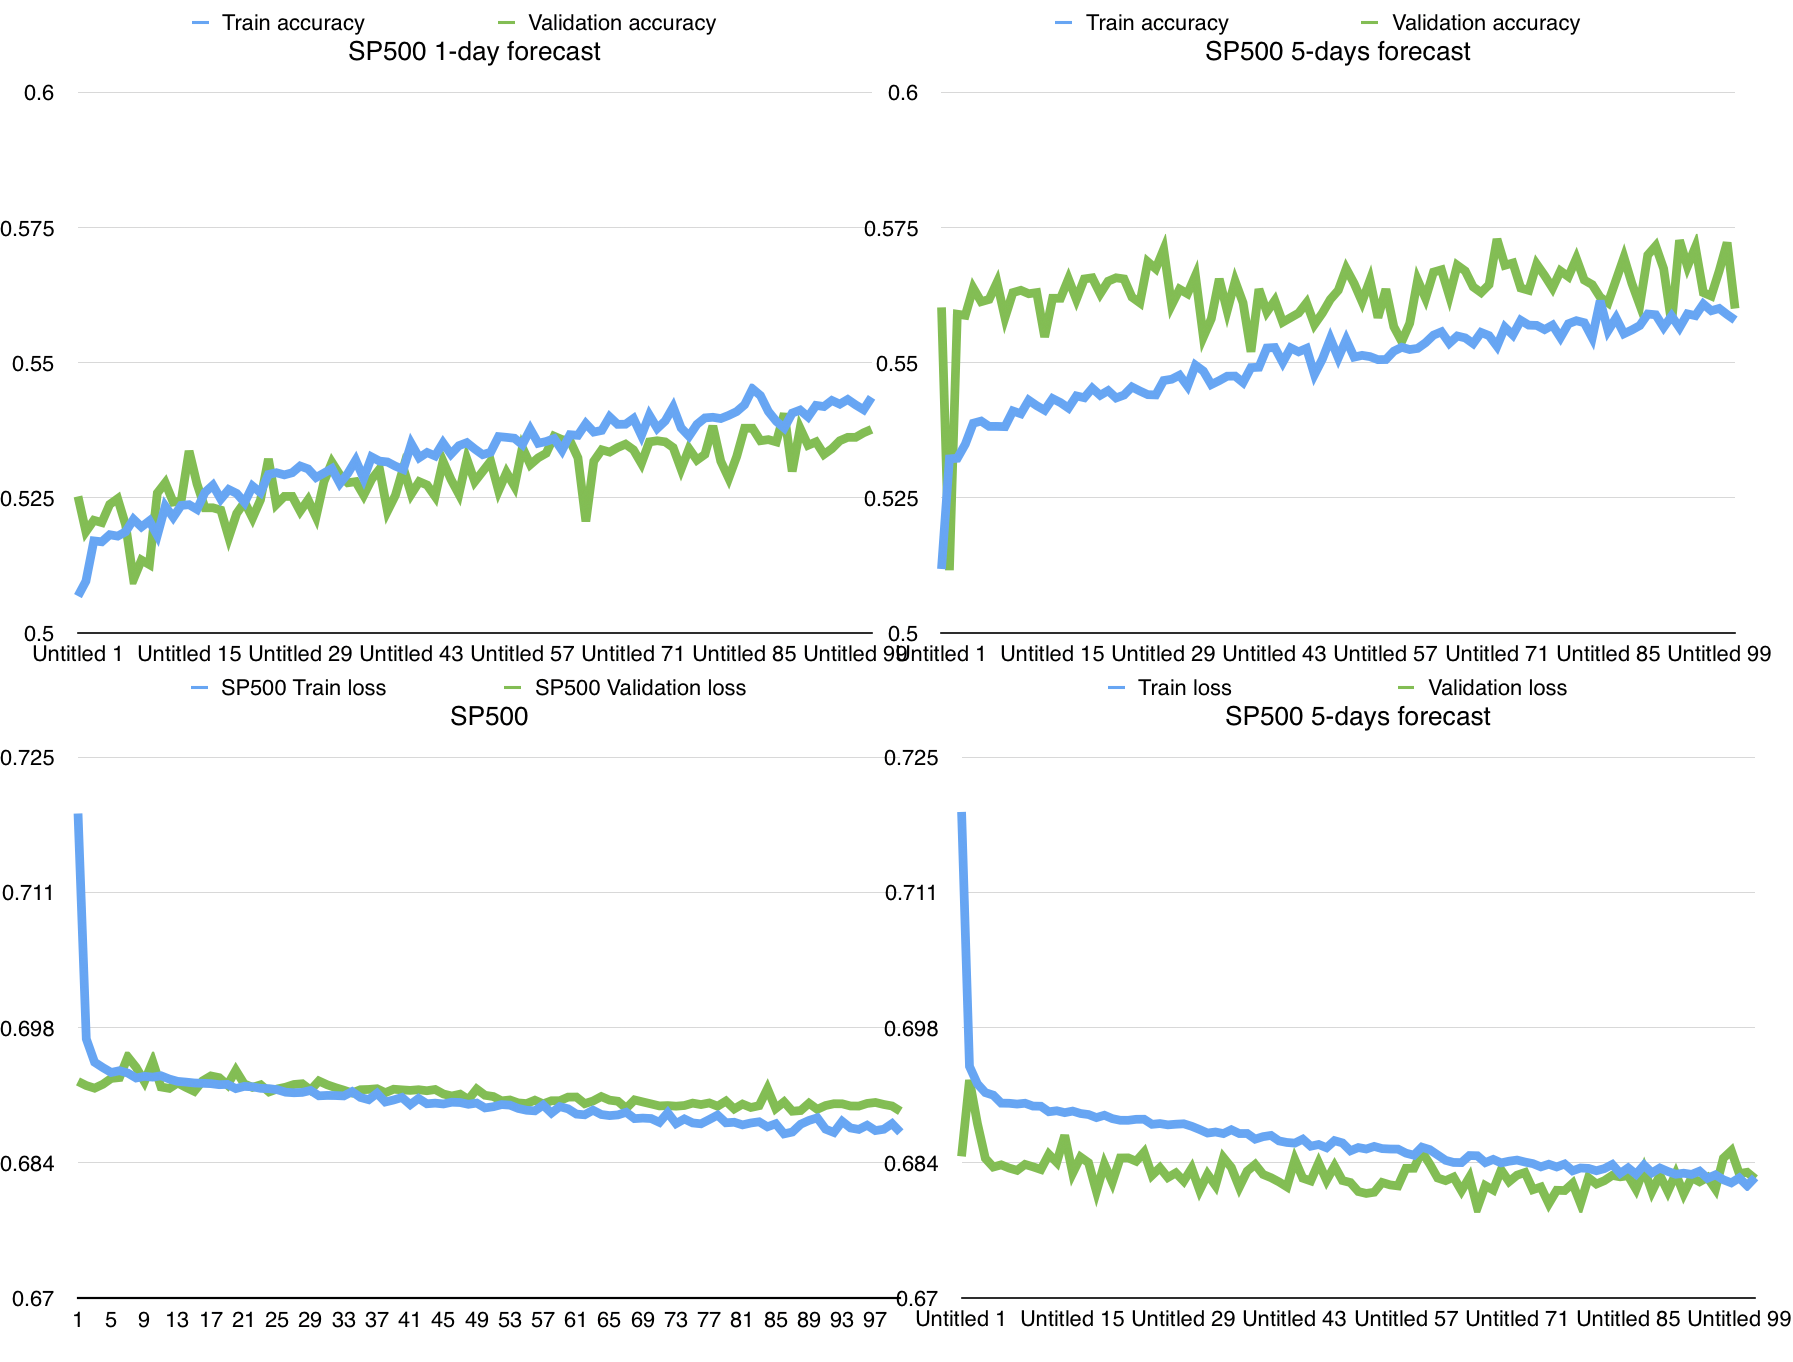
Accuracy (up) and Loss (down) of the CNN doing binary classification on stock movements with 1 day predictions (left) and 5 day predictions (right). [The CNN was again trained on 15 titles of the SP500 (about 40000 entries) with 100 epochs]
So here we have on the left the CNN predicting stocks for 'tomorrow' (1 day prediction), and on the right the CNN predicting stock for 'next week' (5 day prediction). So from the top two charts we see an impressive improvement in the prediction accuracy on new data (validation sample) going from 53%-54% on 1-day forecast to 56-57% on 5-day forecast. Why I am so excited by this result? Because the CNN is now actually able to make useful predictions: the 'validation accuracy' on new data is infact the real accuracy that the Neural Network has when is predicting stocks on the market. To validate this I gave the CNN the last ten years prices of a random title on SP500 and she actually predicted the stock movement correctly 57% of the times (4000 samples, so this 57% is statistically consistent and not just a random output). Amazing, I can feel the scientific progress taking action here. So let's try to analyse this chart and making some objective statments on our CNN, I will call (A) the 1-day forecast and (B) the 5-days forecast.
- 1 - We can observe that in (B) there is an increase in the noise of the data, specifically from the loss function on validation sample.
- 2 - There is an increase in (B) both in the training accuracy and in the validation accuracy, but interestingly enough in (A) Train Acc > Val acc and in (B) Val acc > Train Acc.
- 3 - (A) shows a lower but increasing validation accuracy and (B) shows a higher but not-increasing validation accuracy. This is correlated with the different loss values (crossentropy) on validation sample: higher and decreasing loss in (A), lower, not-so-decreasing and with a high noise loss in (B). (I made some linear regression on the data to check this point)
- 4 - Speaking about training values, (A) and (B) are similar regarding slope and noise but (B) is better at learning the distribution of the data given higher value of train acc and lower value of train loss.
What's next? the way of the Balance seems promising, and I will probably postpone the way of the Change (different architectures) for a while. What I feel as the best next step is to try understand what the charts are telling me: we saw that changing time-frame is good, why and how? Is my intuition correct? How do different timeframes reflect on the training process? I want to understand my data as best as possible in order to maximising the performance playing with timeframes. Moreover, tomorrow I will meet with mr.KX, a PhD from Tsinghua Uni working on RNN to get an opinion on my proj. Looking forward ;>)
Day 4 - Balance the time

This is the class when I met XK at the Uni, he was the TA during our lab on CNN, and today I showed him the project. He told me that I could actually end up with something useful, and gave me a huge insight: I need more data. The 57% I got yesterday is fine, but I am still 'playing' around with my laptop. He told me I should definitely try to train the Neural Network on some big GPUs to get better results. He is right, considering the great improvement I got starting from GOOGL (4000 entries) to 15 titles of the SP500 (40.000 entries), the next step will be definitely train the NN on the WHOLE S&P500 (we are speaking about 2.000.000 entries) or turn to FOREX to get even more data. A nice target would be arrive at a 60% of accuracy on new data still with relatively small training datasets, and go over 60% with the large training datasets. So my current vision is something like this:
- Study more timeframes to get a full understanding of my data, looking at training output for every combination of different parameters (timestep window, prediction time, input price frequency, ecc..)
- Give a try to the way of the change, I wanna try to implement RNN(GRU) RNN(LSTM) and if I feel brave enough try to give a simple implementation of the Wavelet transform for selecting price features
- Build a solid framework to train the Neural Network with hundreds of thousands of samples, and find a supercomputer to run it.
-
So the last couple of hours I wrote a new script that basically iterates the main framework with different hyperparameters; since I am strongly interested in looking at the 'charts' this iterative framework output all the accuracy and loss charts from EVERY model in a huge csv file, this way I should be able to see the exact correlation between hyperparameters and training process. I am going to create a folder to contain all the previous version of my code so you can follow this doc/blog, and I think I will keep the main file 'framework.py' and 'framework_iter.py' as the updated code.
-
I started to launch my iterative framework to 'test' the hyperparameters-couple WINDOW (how many days does the NN prime ) and FORECAST ( how many days in the future predicts ). I decided to choose a dozen of initial combination to genrally see how the CNN behaves, and I am individuating a couple of major trends.
- ATTENTION: HARD TIMES TO COME -
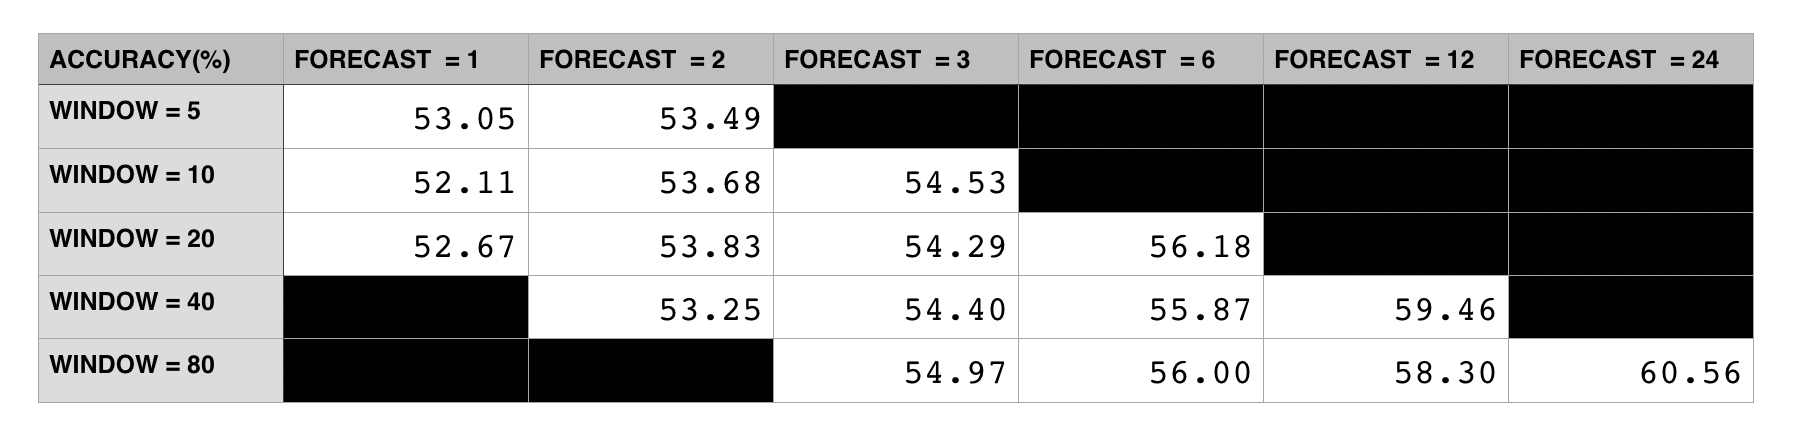
Comparative table for the two hyperparameters WINDOW and FORECAST, the value reported is the prediction accuracy on the validation sample (percentage)
So this was the output of my iterative framework running on the WINDOWtoFORECAST tuple, trying different values of the WINDOW hyperparameter [5,10,20,40,80] and FORECAST hyperparameter [1,2,3,6,12,24]. The results are really clear: a change in the window size doesn't influence our accuracy, instead the higher we increase our forecast interval the better the accuracy. Wait, what? This thing here is saying that the CNN is better at predicting next month prices than tomorrow prices? When I saw I was like: there must be something wrong here. Fortunately I was wise enough to implement in the iterative framework that huge CSV output file with the details about the training process of all the models (every accuracy value is a different model). So I went immediately to have a look and I got what was happening there.
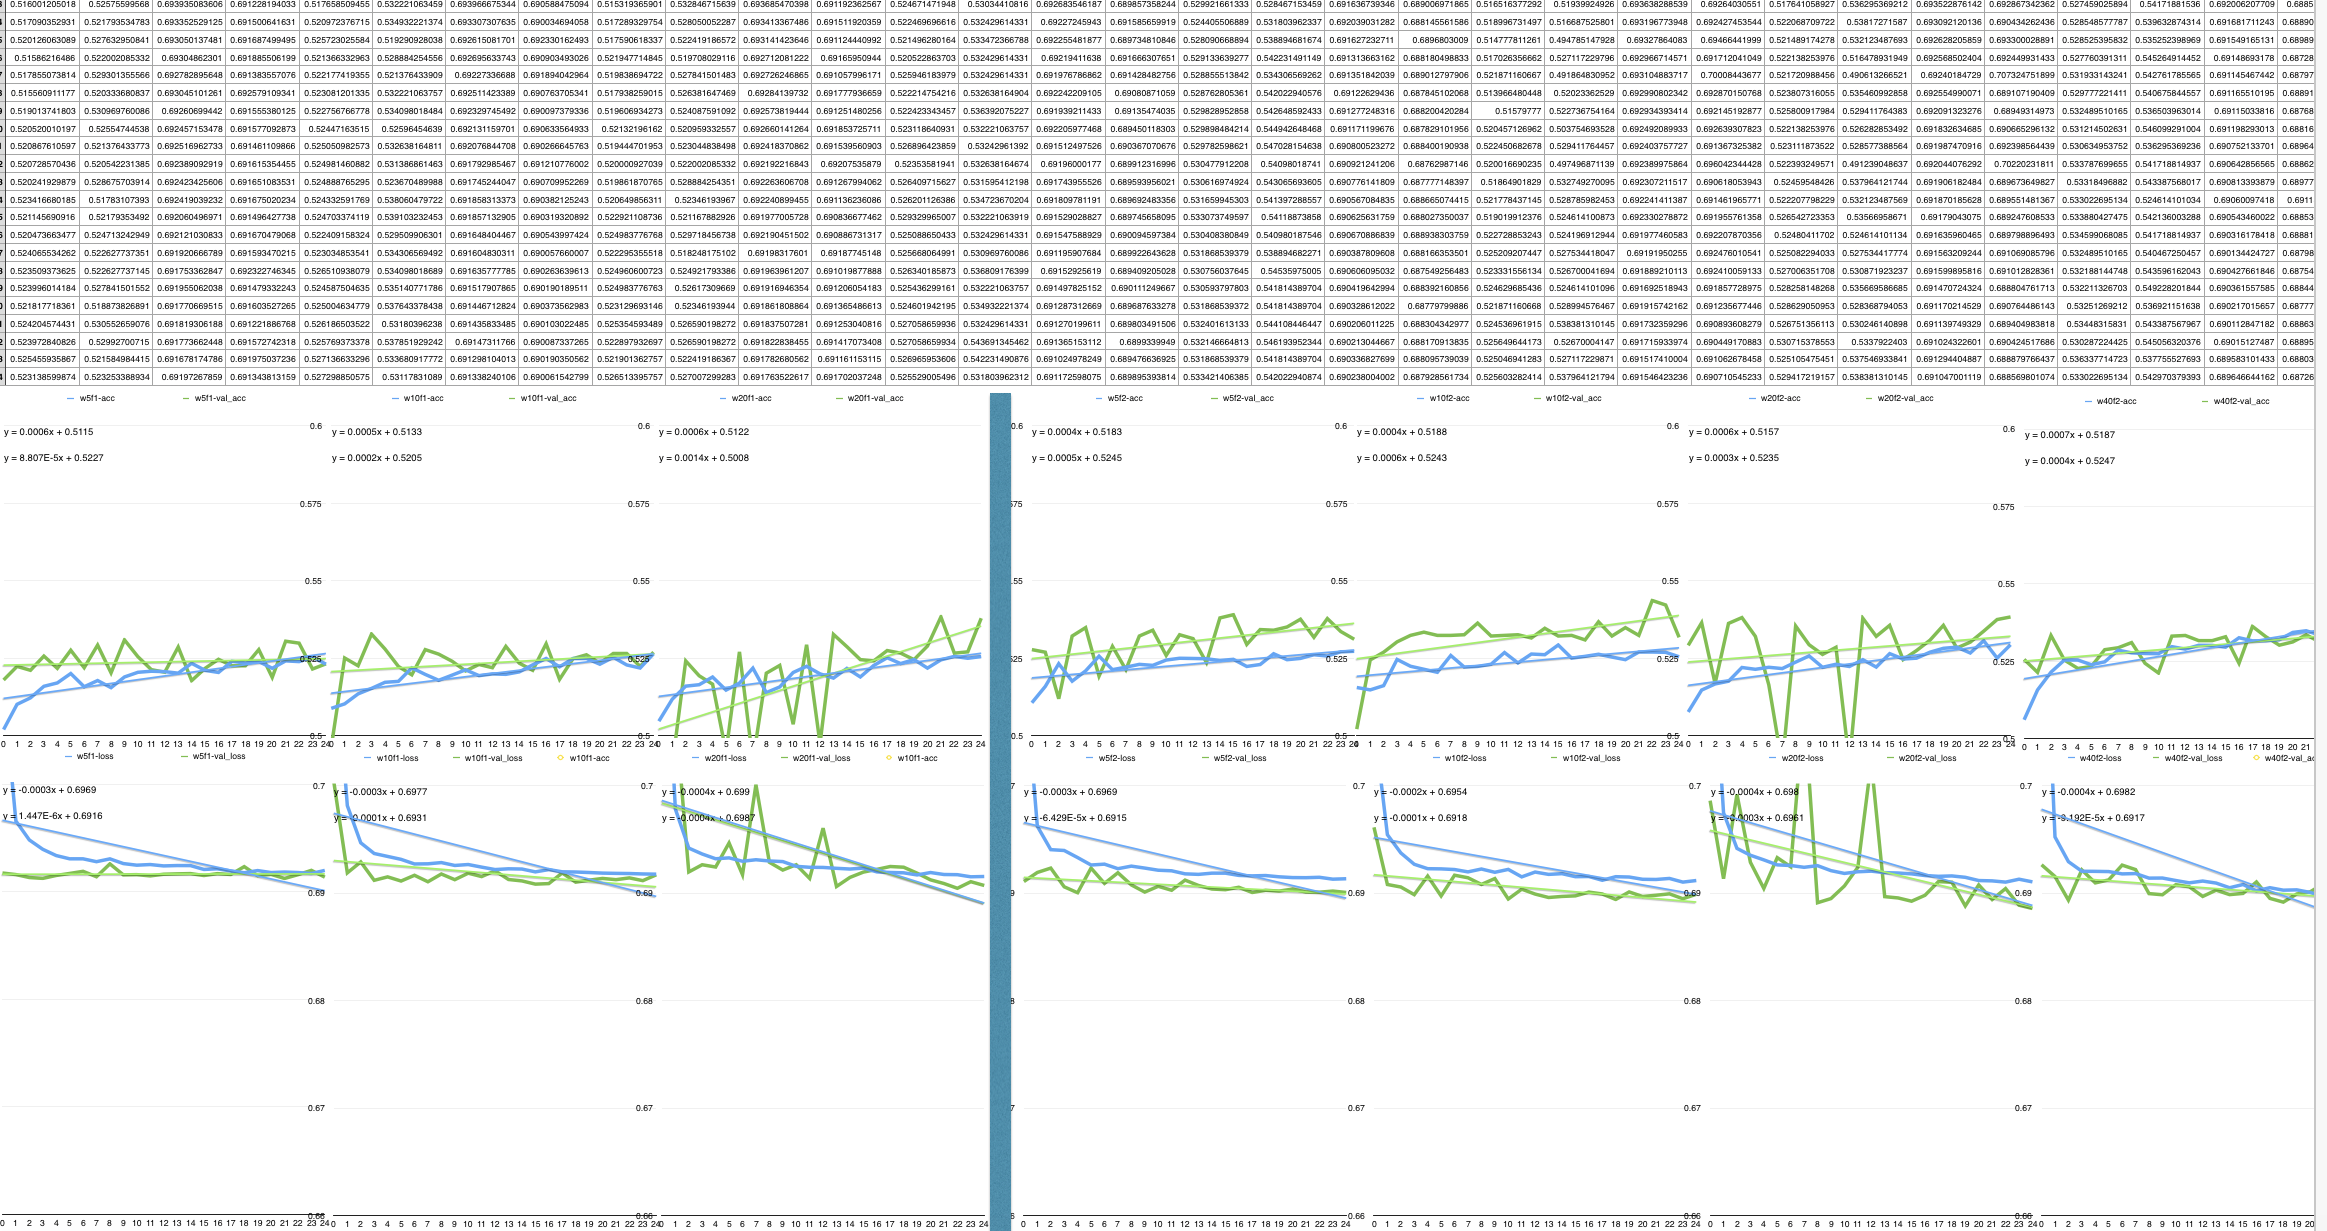
Accuracy and loss values during the training of different model with same FORECAST interval and different WINDOW size
Starting with the easy one (the most expected) the WINDOW interval
doesn't have an actual influence on the performance of the CNN, the
charts above are different model predicting on 2/3 FORECAST interval but
varying a lot the WINDOW size [2,5,10,20], that mean changing the
number of days (timesteps) the CNN can prime to make the forecast: so
no matter how many previous days (WINDOW) we give to the CNN, she will
not improve the predictive power adding just some random noise to model.
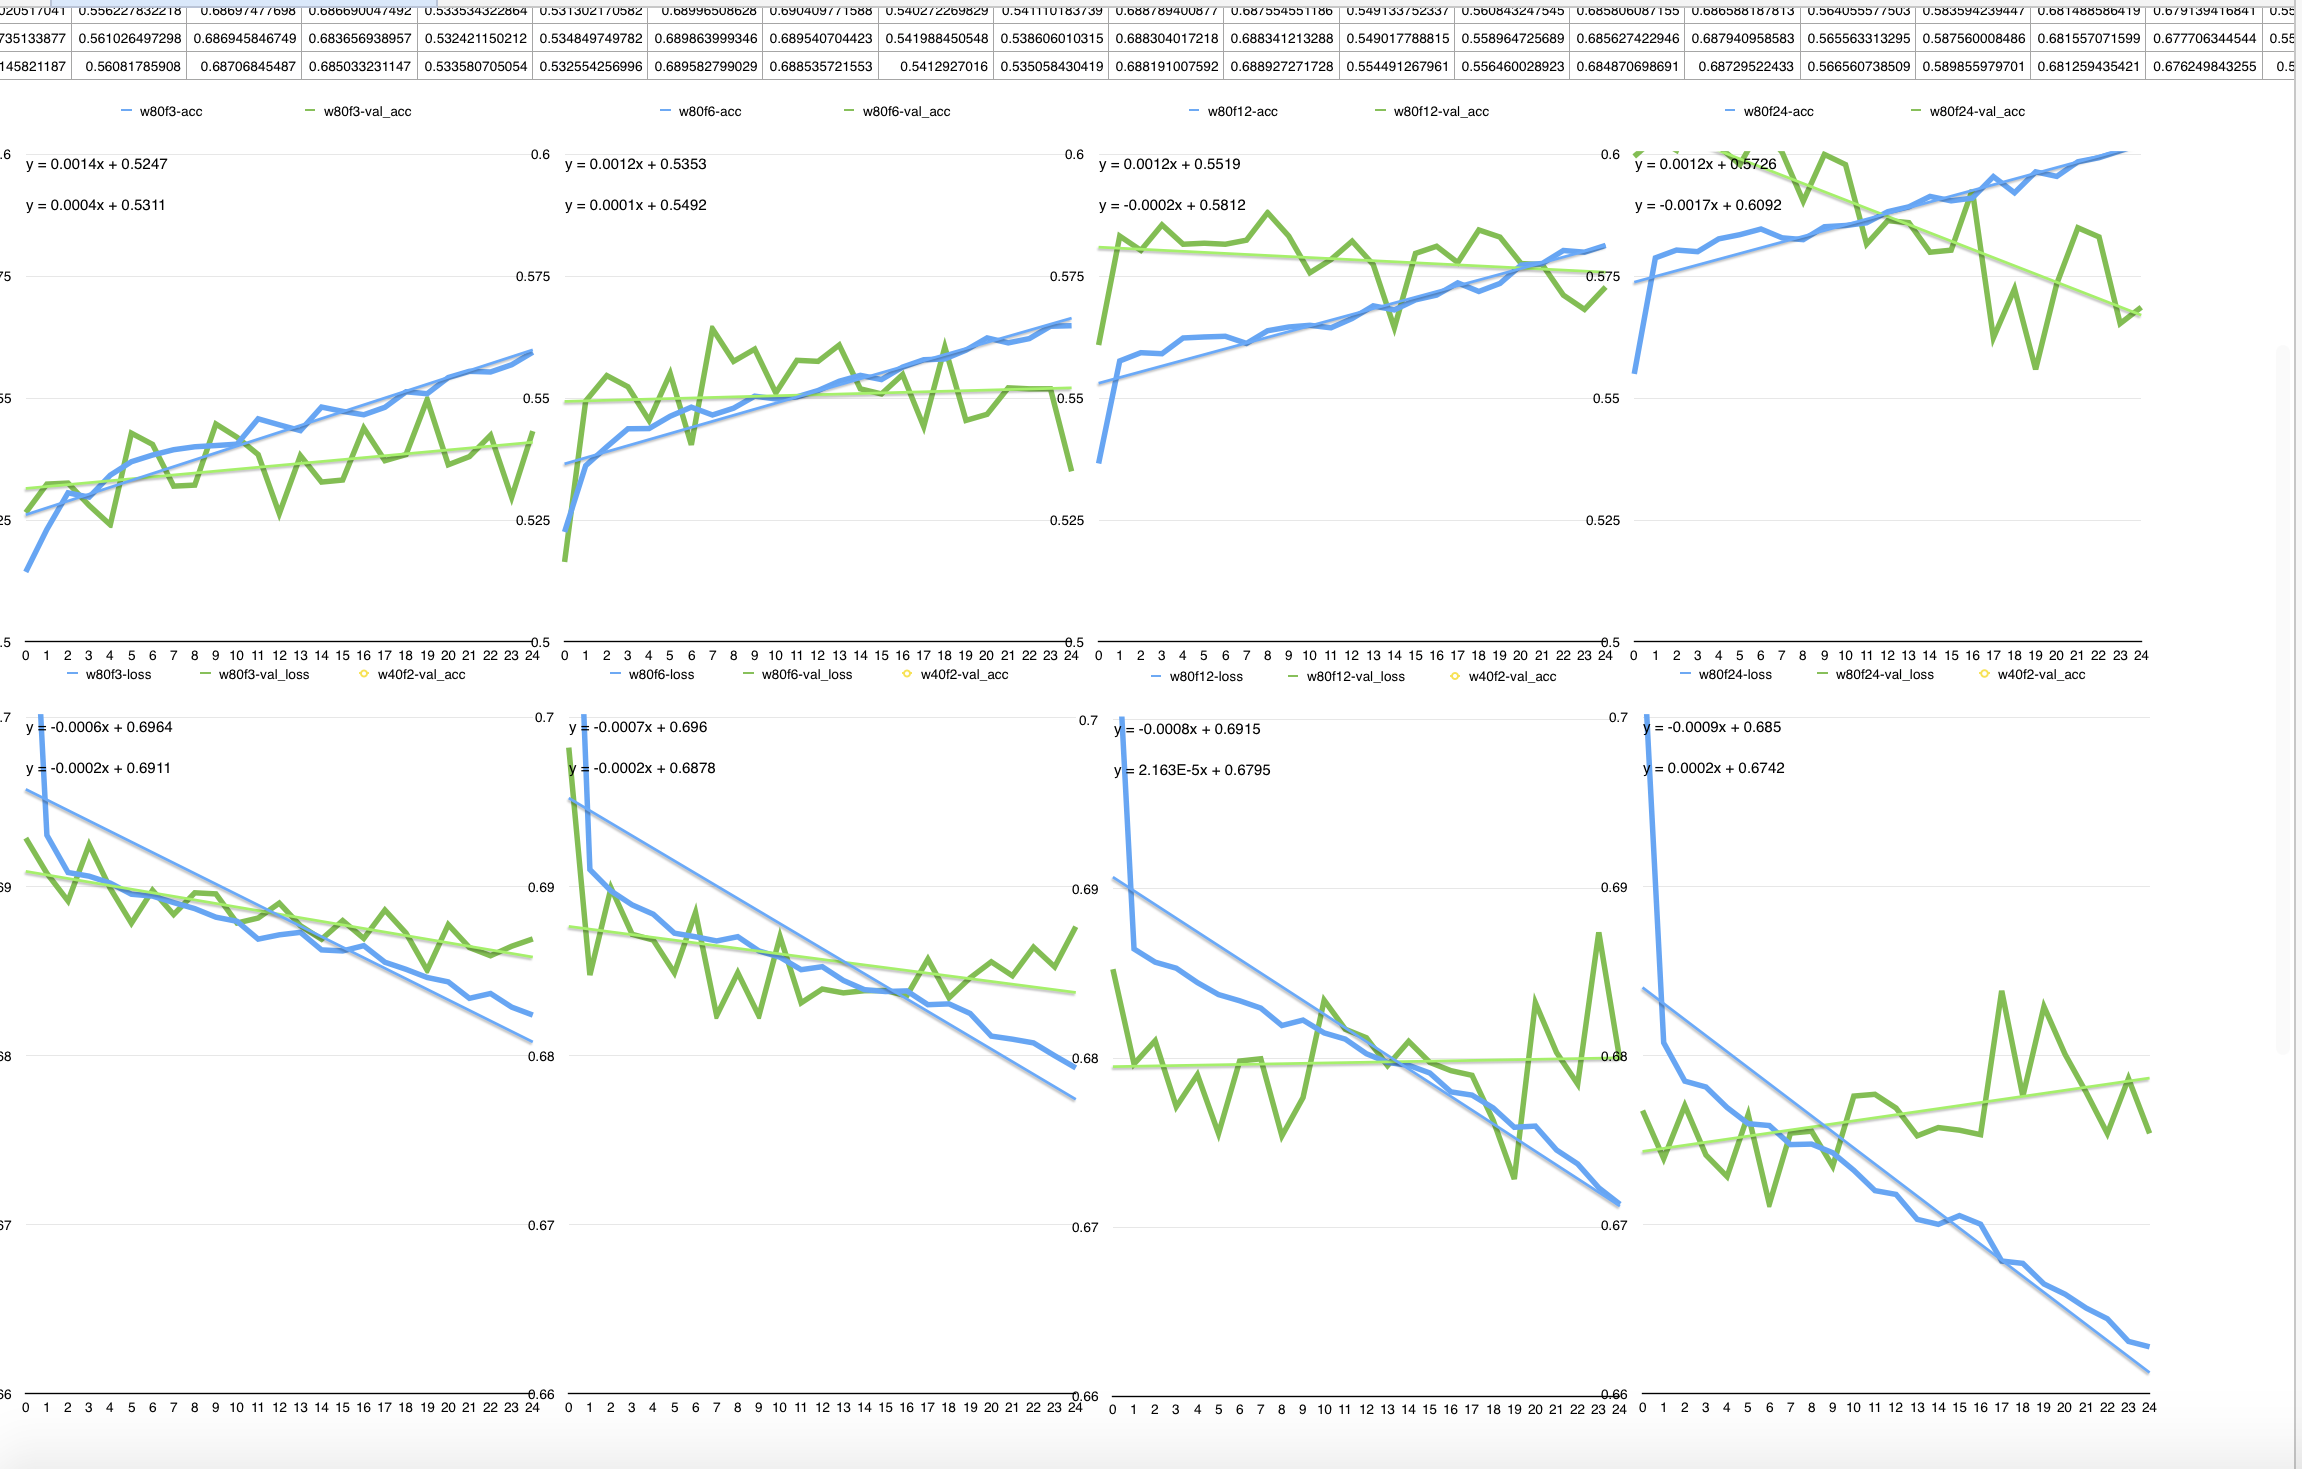
Accuracy and loss values during the training of different model with same WINDOW size (80) and different FORECAST intervals [3, 6, 12, 24]
I must admit that this hit me really hard. If you ever did a bit of
machine learning you can see clearly in this charts what is going on:
overfitting. On 3 days forecast the results are still positive, since we
see that the CNN training is effectful, but on the other timeframes the
CNN is becoming worse and worse at predicting new data (I drew all the
linear regression line to highlight the trends in the loss and accuracy
changes). After trying a lot to understand what's going on I would say
that the forecasting interval maximizes the CNN performance between 3
and 5 days (of prediction), intervals bigger than 5 days the CNN just
dramatically overfit and lose any prediction power.
-
So, couple of hours later I still have the pessimistic view on this framework I had after seeing the last charts. Why is that? If you didn't spot it, there is a huge problem, a black storm at the horizon. We still have our good (reliable) result of 56%-57% accuracy we got yesterday [Day3], but the model itself is corrupted: the CNN show an increasing validation accuracy but in truth it's just having a huge overfit on the whole dataset. You could say 'Well Alex, just don't increase the FORECAST hyperparameters and it doesn't over fit'. OK :) But the point is that our validation accuracy is not a good measure anymore of the performance of our CNN, just remember that FORECAST = 24 generates a validation accuracy of over 60%! That is obviously false, since the big overfit: just try with other validation samples and the CNN fall down to a neat 50%. (Yes I spent the last hours validating every model on different validation samples)
OK to sum up what we got today and what is next here is a brief list
- Our best result up to now is a 56%/57% accuracy on 5 DAYS forecast on Stock Prices of S&P500. I actually ran the model on other stocks and it still work at a pretty high accuracy (varying from 54 5 to 56%)
- Our framework is corrupted as I just explained above. The reason in my opinion is data: I have been throwing this big data in the model not caring so much about the organization of the dataframe, and I end up with bad quality data. And bad quality data I mean I have a dataframe not-well constructed that tricks the Neural Network, that overfits showing high validation accuracy.
- The priority now is to build a new version of the dataframe that uses better data and organize them in a better way. This will be I think the main topic for tomorrow. On this new framework I will build the RNN and the multi-classification model that should really boost my accuracy. I decided to call the framework I have been working on up to now v.0.1-Framework and the one I will start tomorrow (day 5) v.0.2-Framework
note: what I learned from today: is all about data, today I got the first big setback in the project and I started questioning the very nature of NN. If you take some famous example like MNIST, why do all the CNN models built on MNIST dataset work so well (99.5% accuracy)? Of course they are great model, but the real golden nugget there is the dataset, that was infact buily by our friend Yan. If you want a great result, you need a great dataset.
Day 5 - the FOREX way
It's time to build a new dataframe, and to improve the framework to manage the dataframe. I need a huge amount of high quality data, that come from the same distribution and are not so heavily influenced by market conditions. The answer is FOREX, the market of exchange currencies. Why is that? Big volume. The FOREX is the market with largest volume traded, and this means that there is an huge amount of trading data regarding the market transaction. I will use dukascopy, where you can find for free the minute-by-minute exchange rate of the major currencies of the last 20 years. Yes, minute-by-minute, it means having over 2 million entries considering a 5/10years time frame JUST for one currencies pair. And not only this, what I like about minute-date on the FOREX is that the patterns in them are not so influenced by market conditions: GOOGL is traded today very differently compared with how it was traded last month, this is because of the different market condition, but EUR/USD is traded with same market conditions today afternoon compared to morning since the market condition are pretty the same, thus our NN should be better and recognizing patterns. So let's have a look at the framework-v.0.2 I am building
Framework-v.0.2 /main new features
- Dataset build and cleaning: the framework download and clean the minute-by-minute forex data
- Dataset analysis utilites: I built a couple utilites that let you check the 'health' status of the dataframe, looking at dead period and other non-consistencies.
- Testing utilites: since the problems I had with testing on val_accuracy I wrote a couple utilites also here to test my results better, mainly based on parametric algorithmic trading
Here are some of the first results I got with FOREX minute data
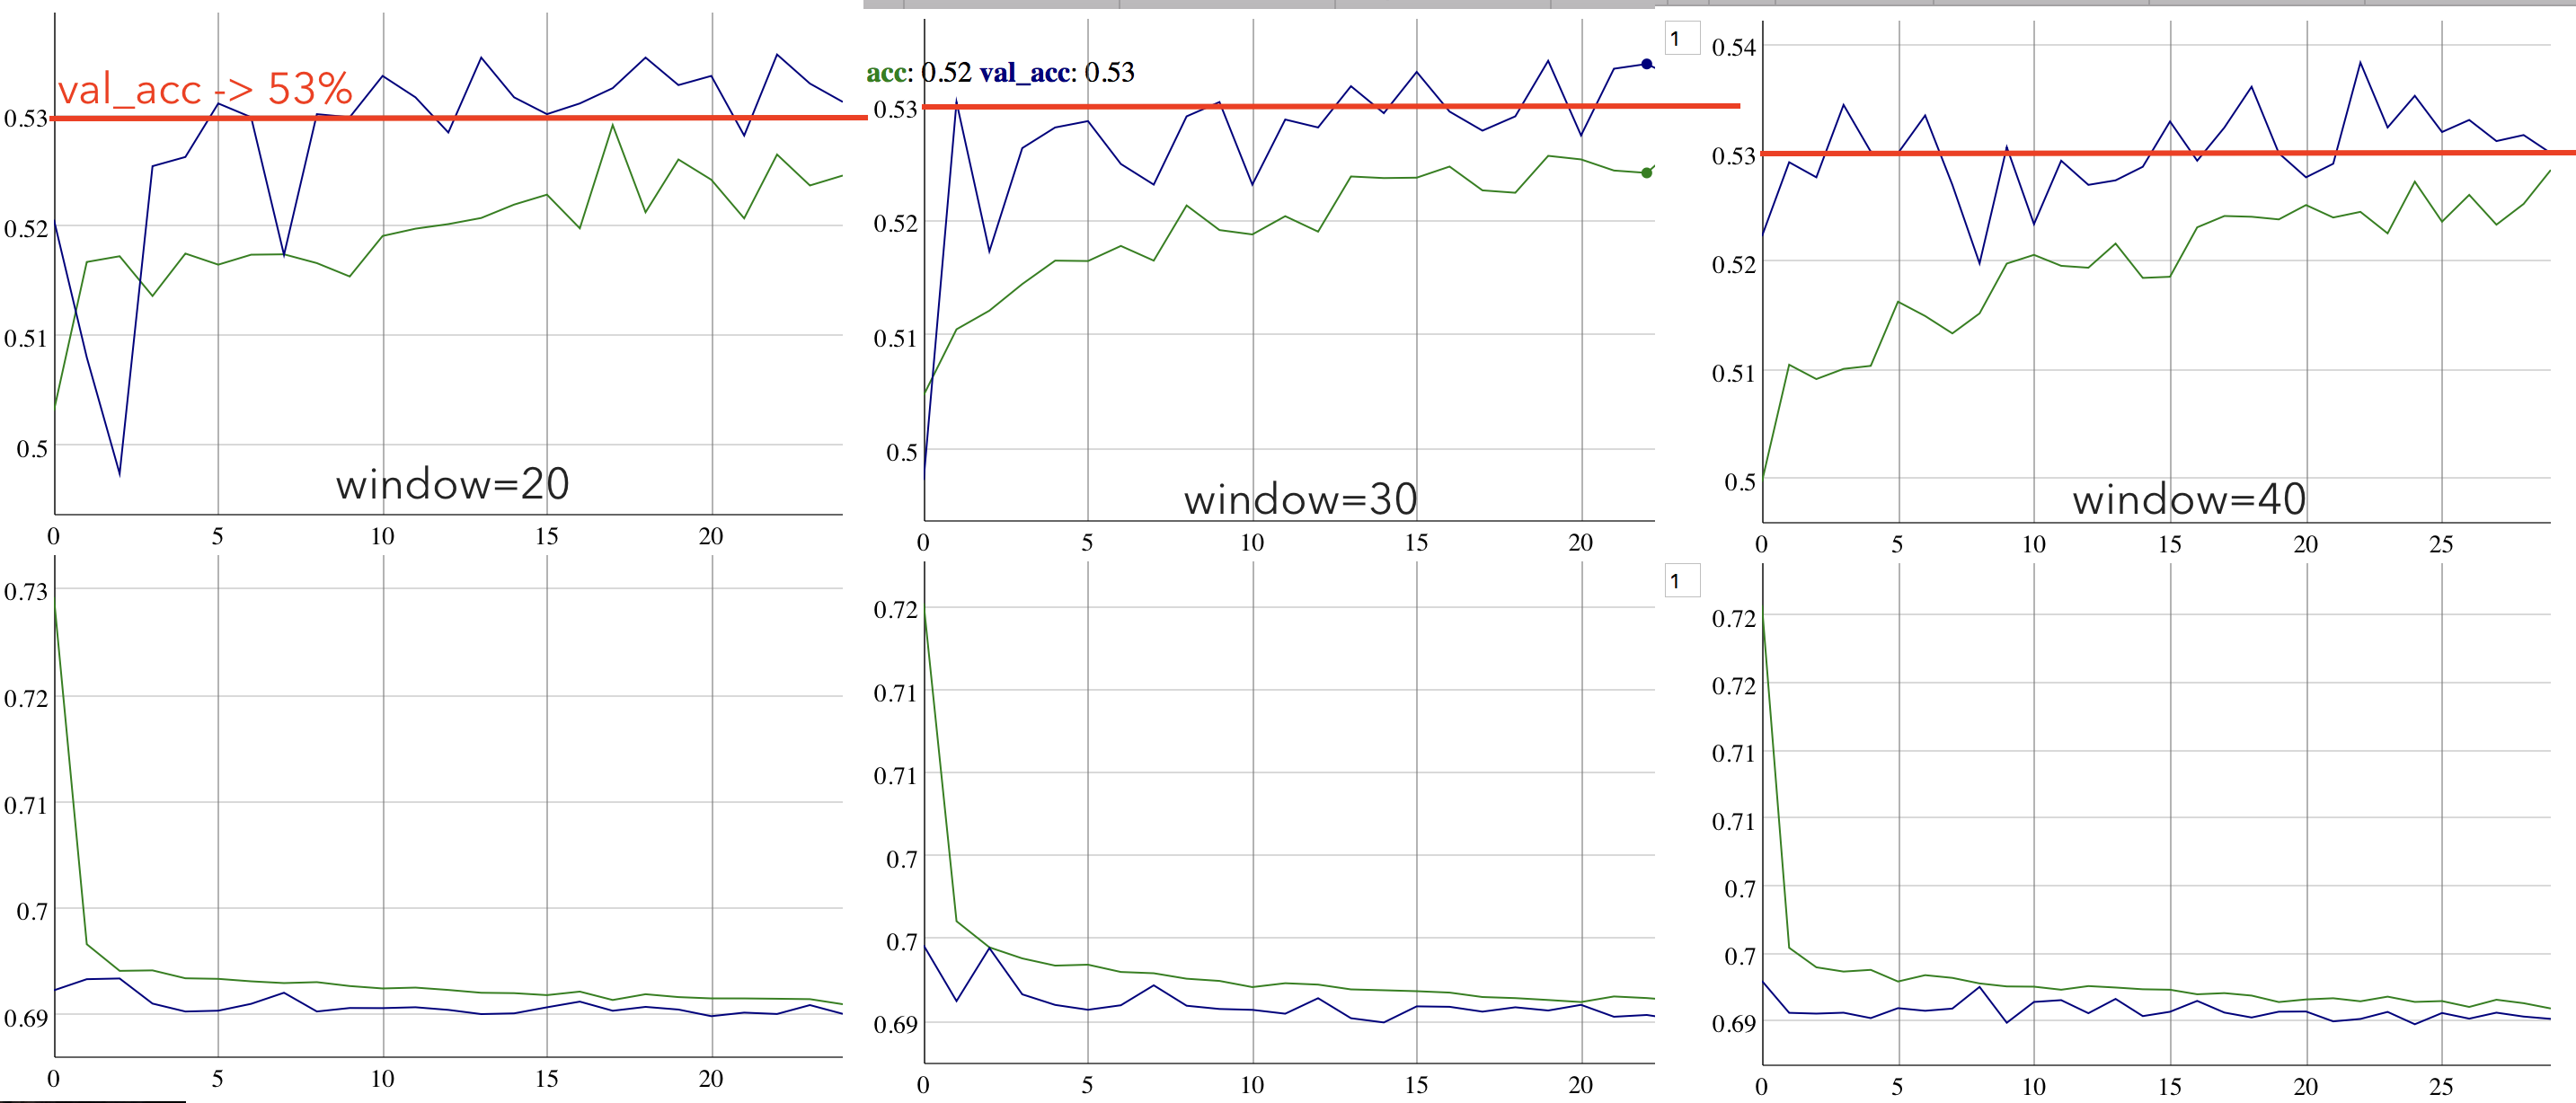 p>I trained the CNN on 40000 inputs in my dataframe with three
different time windows. I would say we are having pretty good result,
with a validation accuracy ranging from 53-54% but most importantly with
a HEALTHY training process: the loss values are always decreasing, and
in the 40-periods window it goes even under 0.69. This is a great result
actually, since the CNN is learning the patterns in the FOREX minute
data as we were predicting. In the meantime I just got a new idea,
about testing the performance. So right now we are just giving this
validation accuracy based on which probability of the output vector
[p1,p2] is greater (hotvector style). In the new version of the
framework v.0.2 I implemented some new testing utitlities that implement
some parametric algorithmic trading, really simple actually; it works
like this: there is a number Alfa usually 0.55 or 0.6, if p1 or p2 is
bigger than Alfa than the CNN is telling you trade the currency pair,
otherwise just don't do anything . This is going really much towards
the original multi-classification ideas we had at the first days, but
it turned out it work really well, up to now I got excellent results
that I will show you tomorrow with a better utility.
p>I trained the CNN on 40000 inputs in my dataframe with three
different time windows. I would say we are having pretty good result,
with a validation accuracy ranging from 53-54% but most importantly with
a HEALTHY training process: the loss values are always decreasing, and
in the 40-periods window it goes even under 0.69. This is a great result
actually, since the CNN is learning the patterns in the FOREX minute
data as we were predicting. In the meantime I just got a new idea,
about testing the performance. So right now we are just giving this
validation accuracy based on which probability of the output vector
[p1,p2] is greater (hotvector style). In the new version of the
framework v.0.2 I implemented some new testing utitlities that implement
some parametric algorithmic trading, really simple actually; it works
like this: there is a number Alfa usually 0.55 or 0.6, if p1 or p2 is
bigger than Alfa than the CNN is telling you trade the currency pair,
otherwise just don't do anything . This is going really much towards
the original multi-classification ideas we had at the first days, but
it turned out it work really well, up to now I got excellent results
that I will show you tomorrow with a better utility.
- Cleaning utility
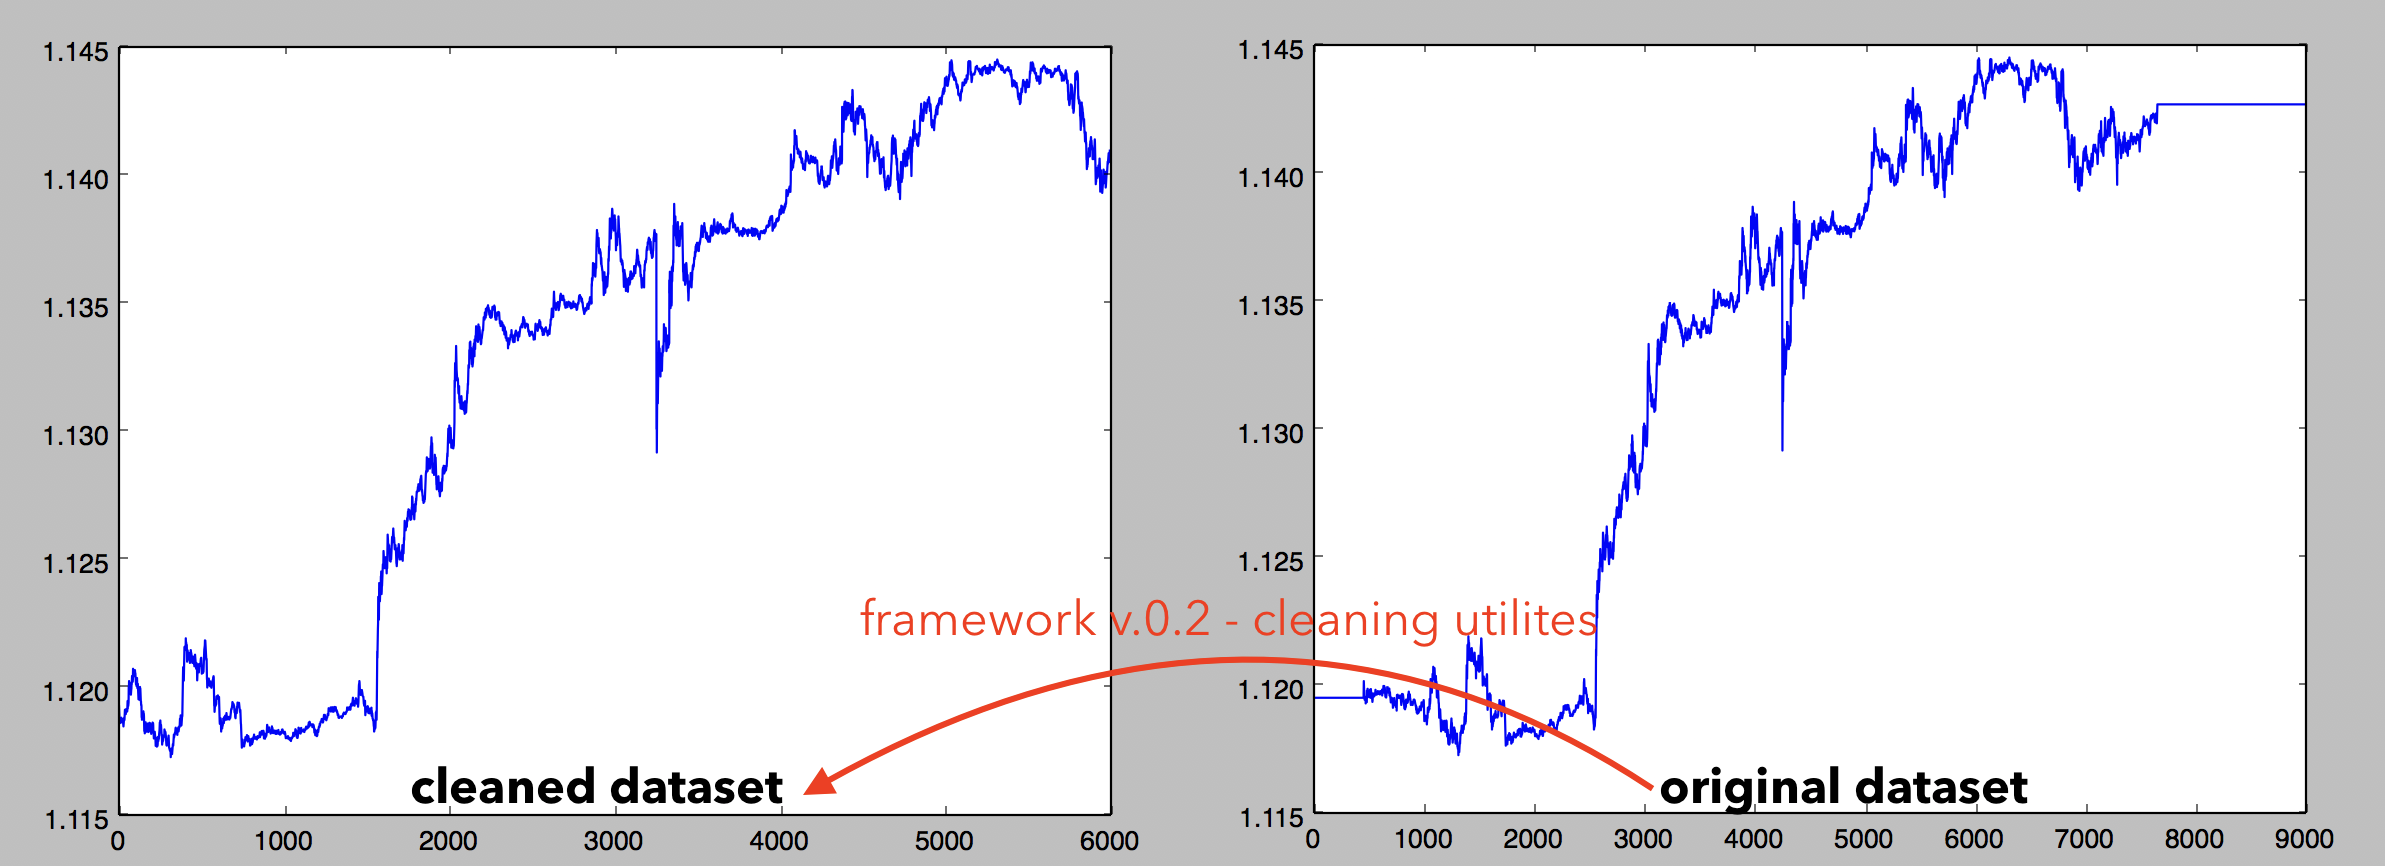
Here is a visualization of the cleaning utility I just wrote, you can see on the right the original dataset and on the left the cleaned dataset. You can see many dead periods and other inconsistencies (due to weekend market closing for instance) automatically cleaned by the utilites
- Algorithmic (parametric) Trading/Prediction Testing
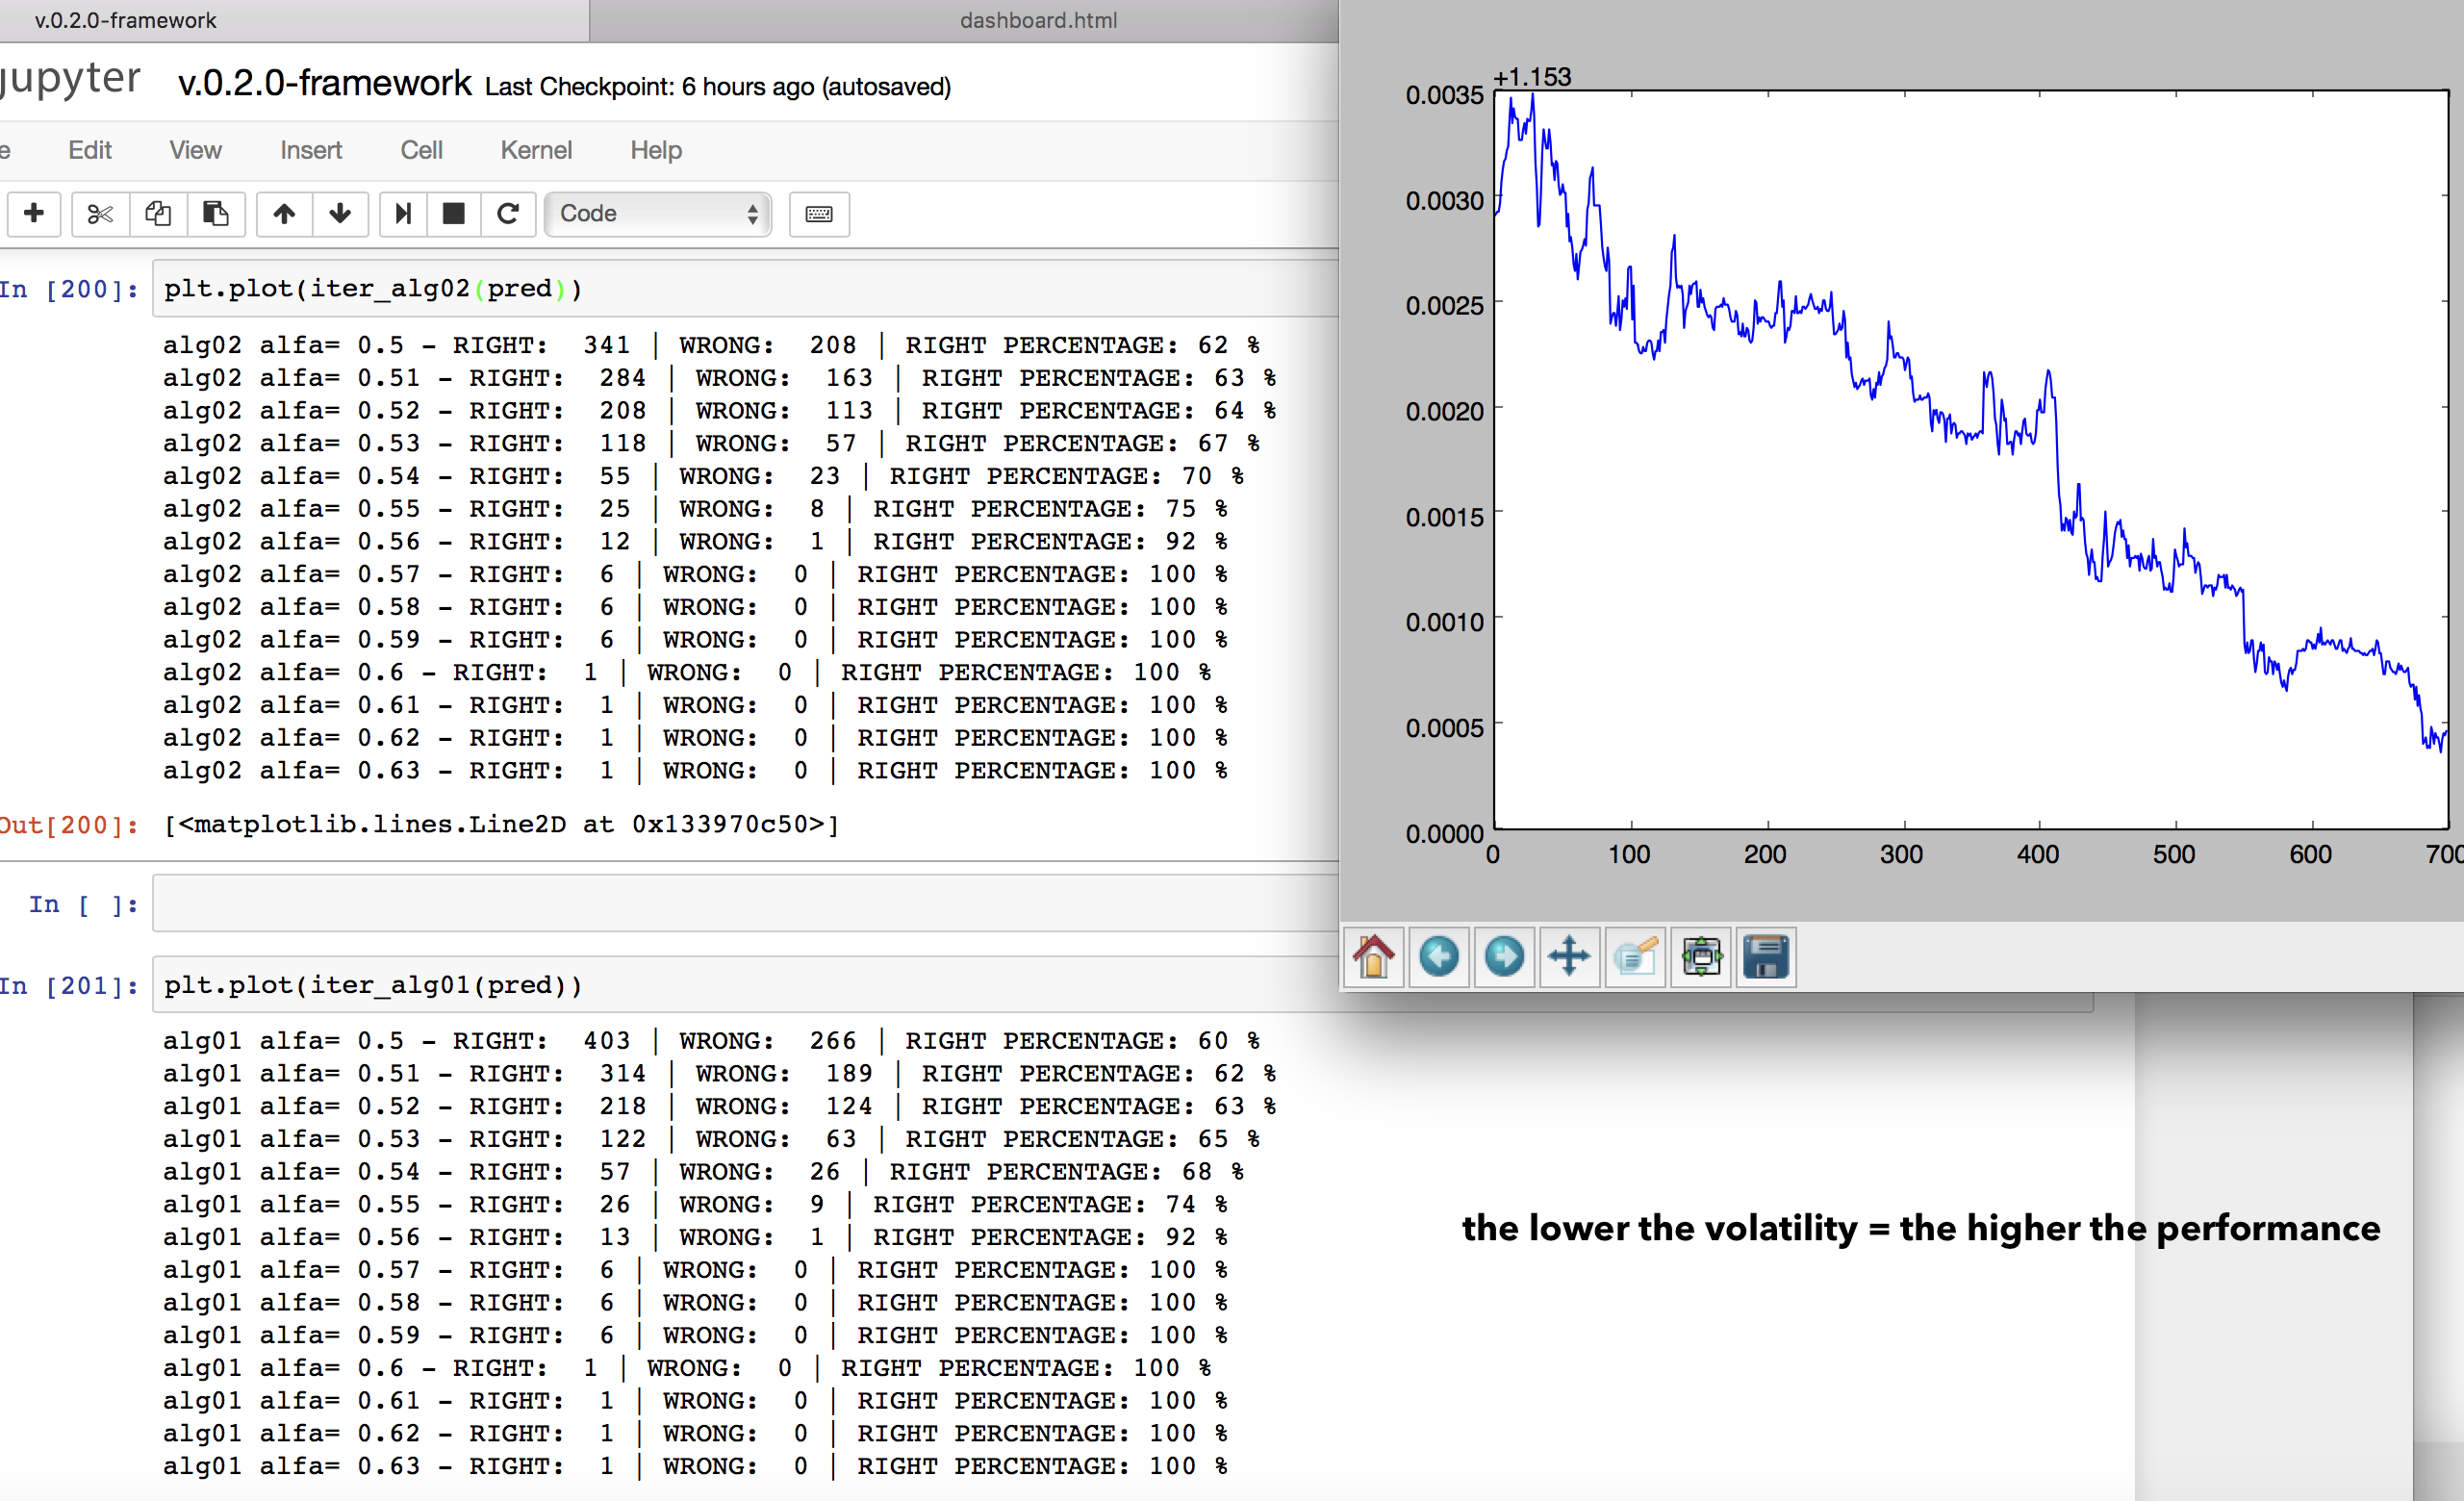
To test the performance of our CNN I implemented a simple one-parametric trading algorithm that runs on NEW data (not from the validation sample but completely new downloaded data, consecutive to the validation and testing ones). The algorithm just 'bet' on tomorrow price if the accuracy of the prediction (p1 or p2) is bigger than alfa.
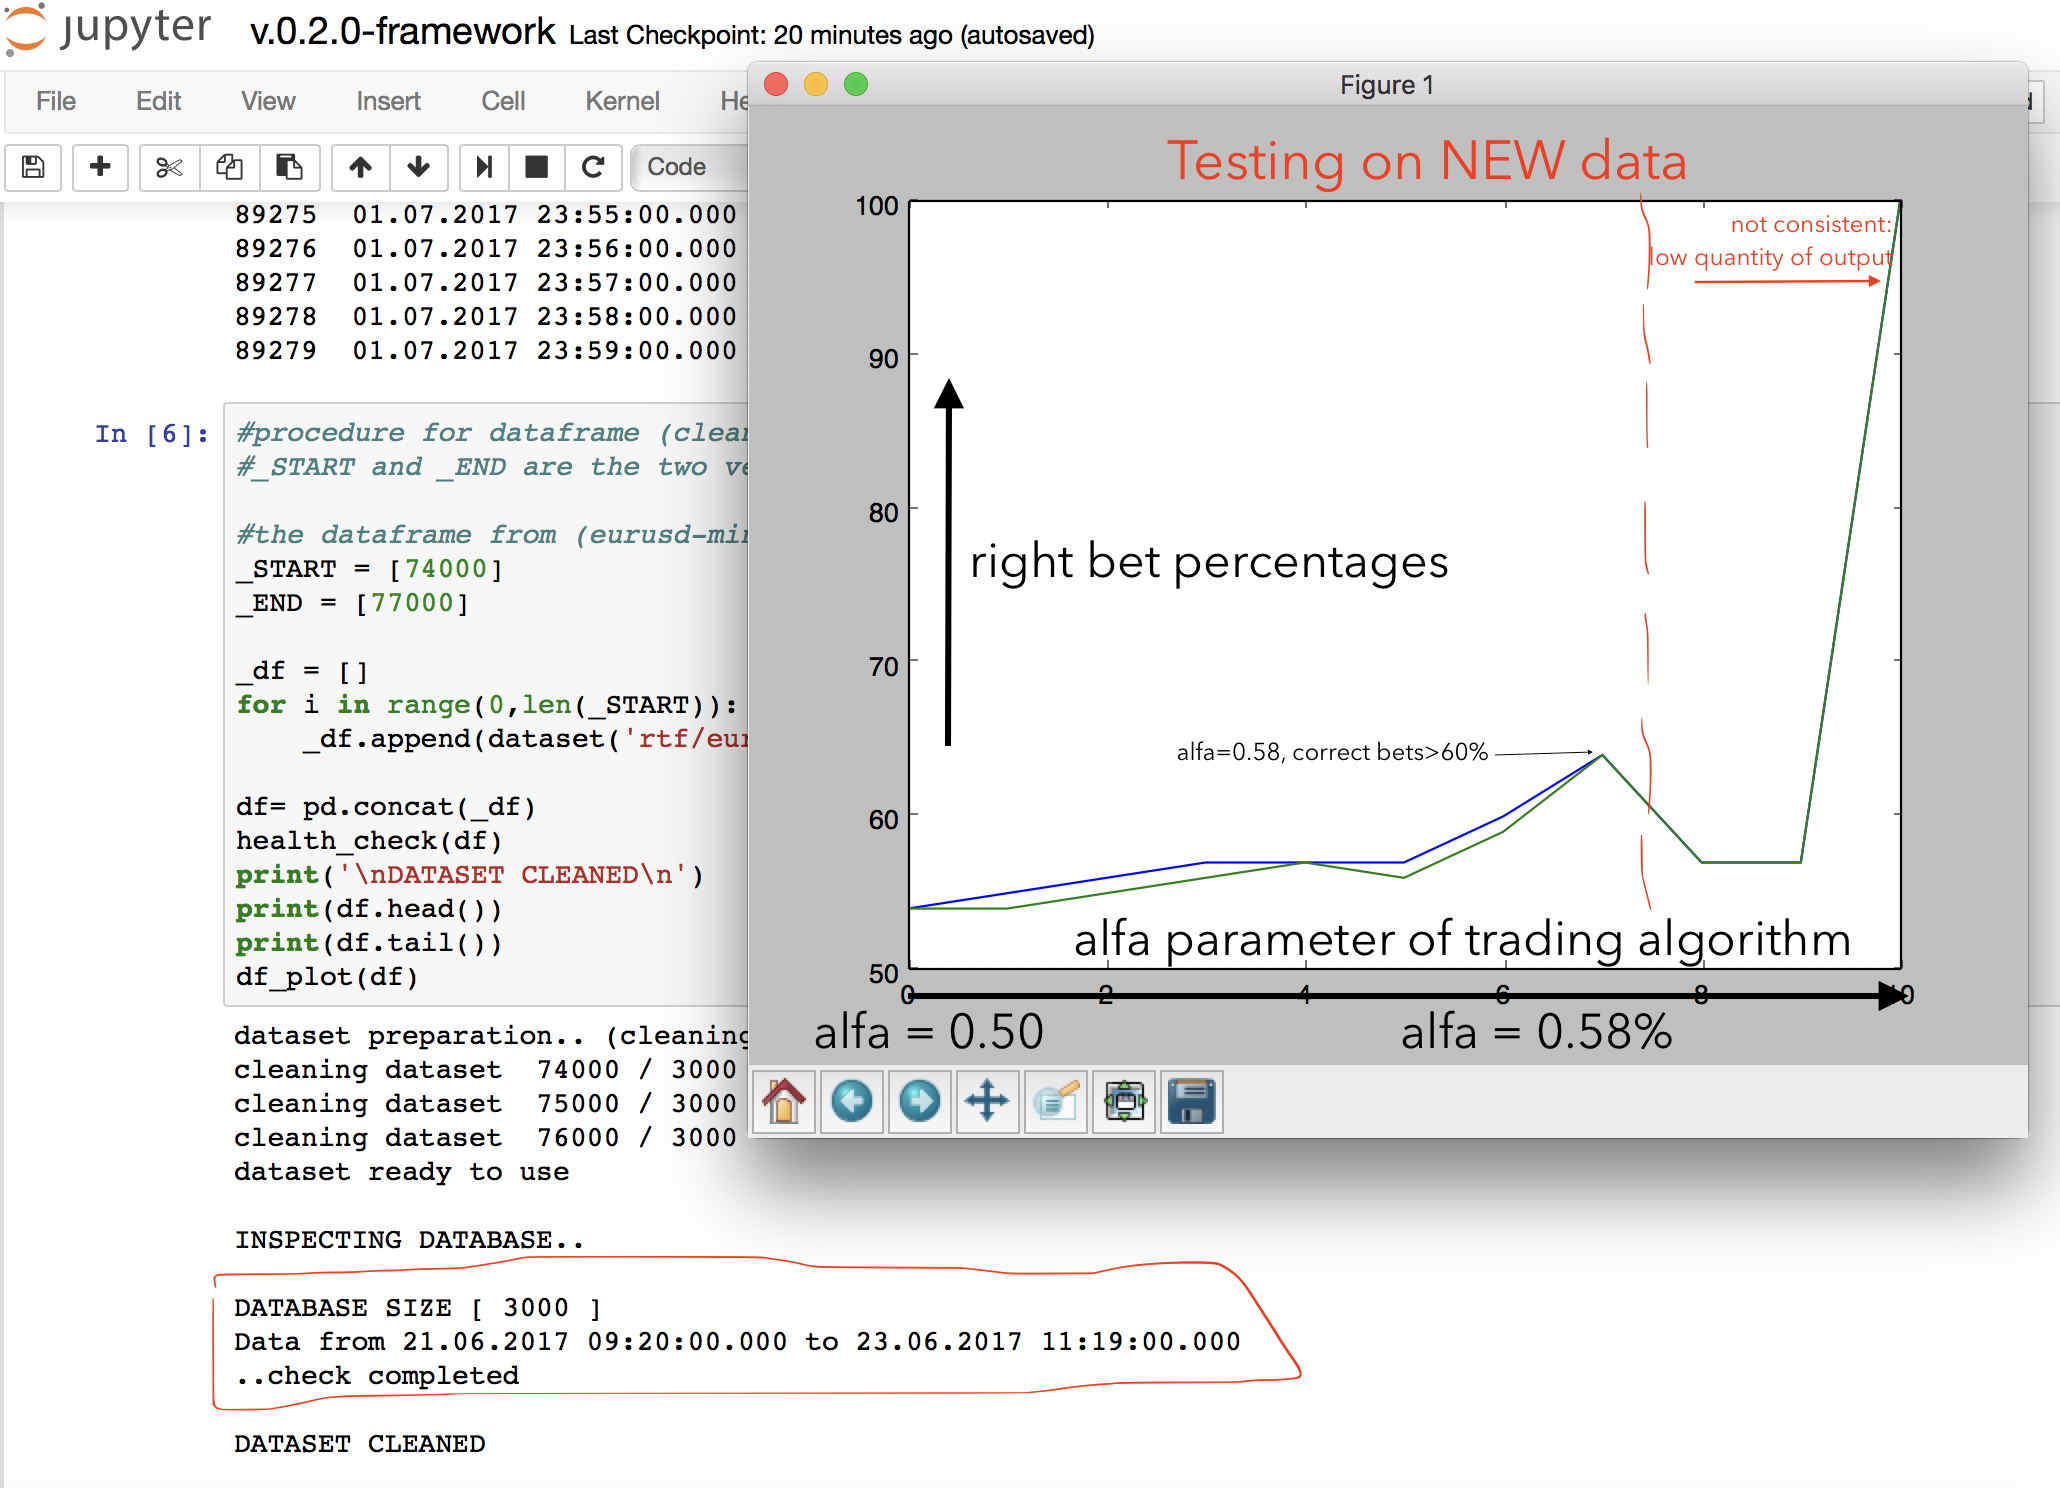
Here is the outcome of the trading algo, in my opinion really positive. Increasing alfa, that is increasing how selective is the algo in 'accepting' predictions from the Neural Network, we have a substancial imporvement in the performance of the algo. We have here a succesfull trading strategy, even if it's yet really basic. When alfa increases to much the performance goes to 100% (and this is great) but of course this result is not consistence since the algo is practically rejecting all the predictions from the NN and picking just 1 or 2 predictions on the full 40000 dataset.
Day 6 - going BIG
Ok, I was pretty positive about last days results so I wanted to try increasing the size of the data. Not only to test my current model (binary classification CNN) but to actually analyse the difference between medium-size datasets and large-size datasets. I am using minute-data from currency exchange and here is the data scale I am working on right now.
- Medium size dataset: training (+validation) on 1 month window [20.000-40.000 entries] testing on 1 week window [5000 entries]
- Large size dataset: training (+validation) on 1 year window [500.000-1.000.000 entries] testing on 1 month window [20.000-40.000]
So i tried with a large-size dataset, training from 07/2016 to 07/2017 with EUR/USD (euro-dollar) minute exchange prics (OHLCV) and testing the model from 07/2017 to 08/2017 (last month). Here is the result of my trading algorithm on 07/2017 to 08/2017 trading (the model did NOT have the last month data during the training so the test is on real new data
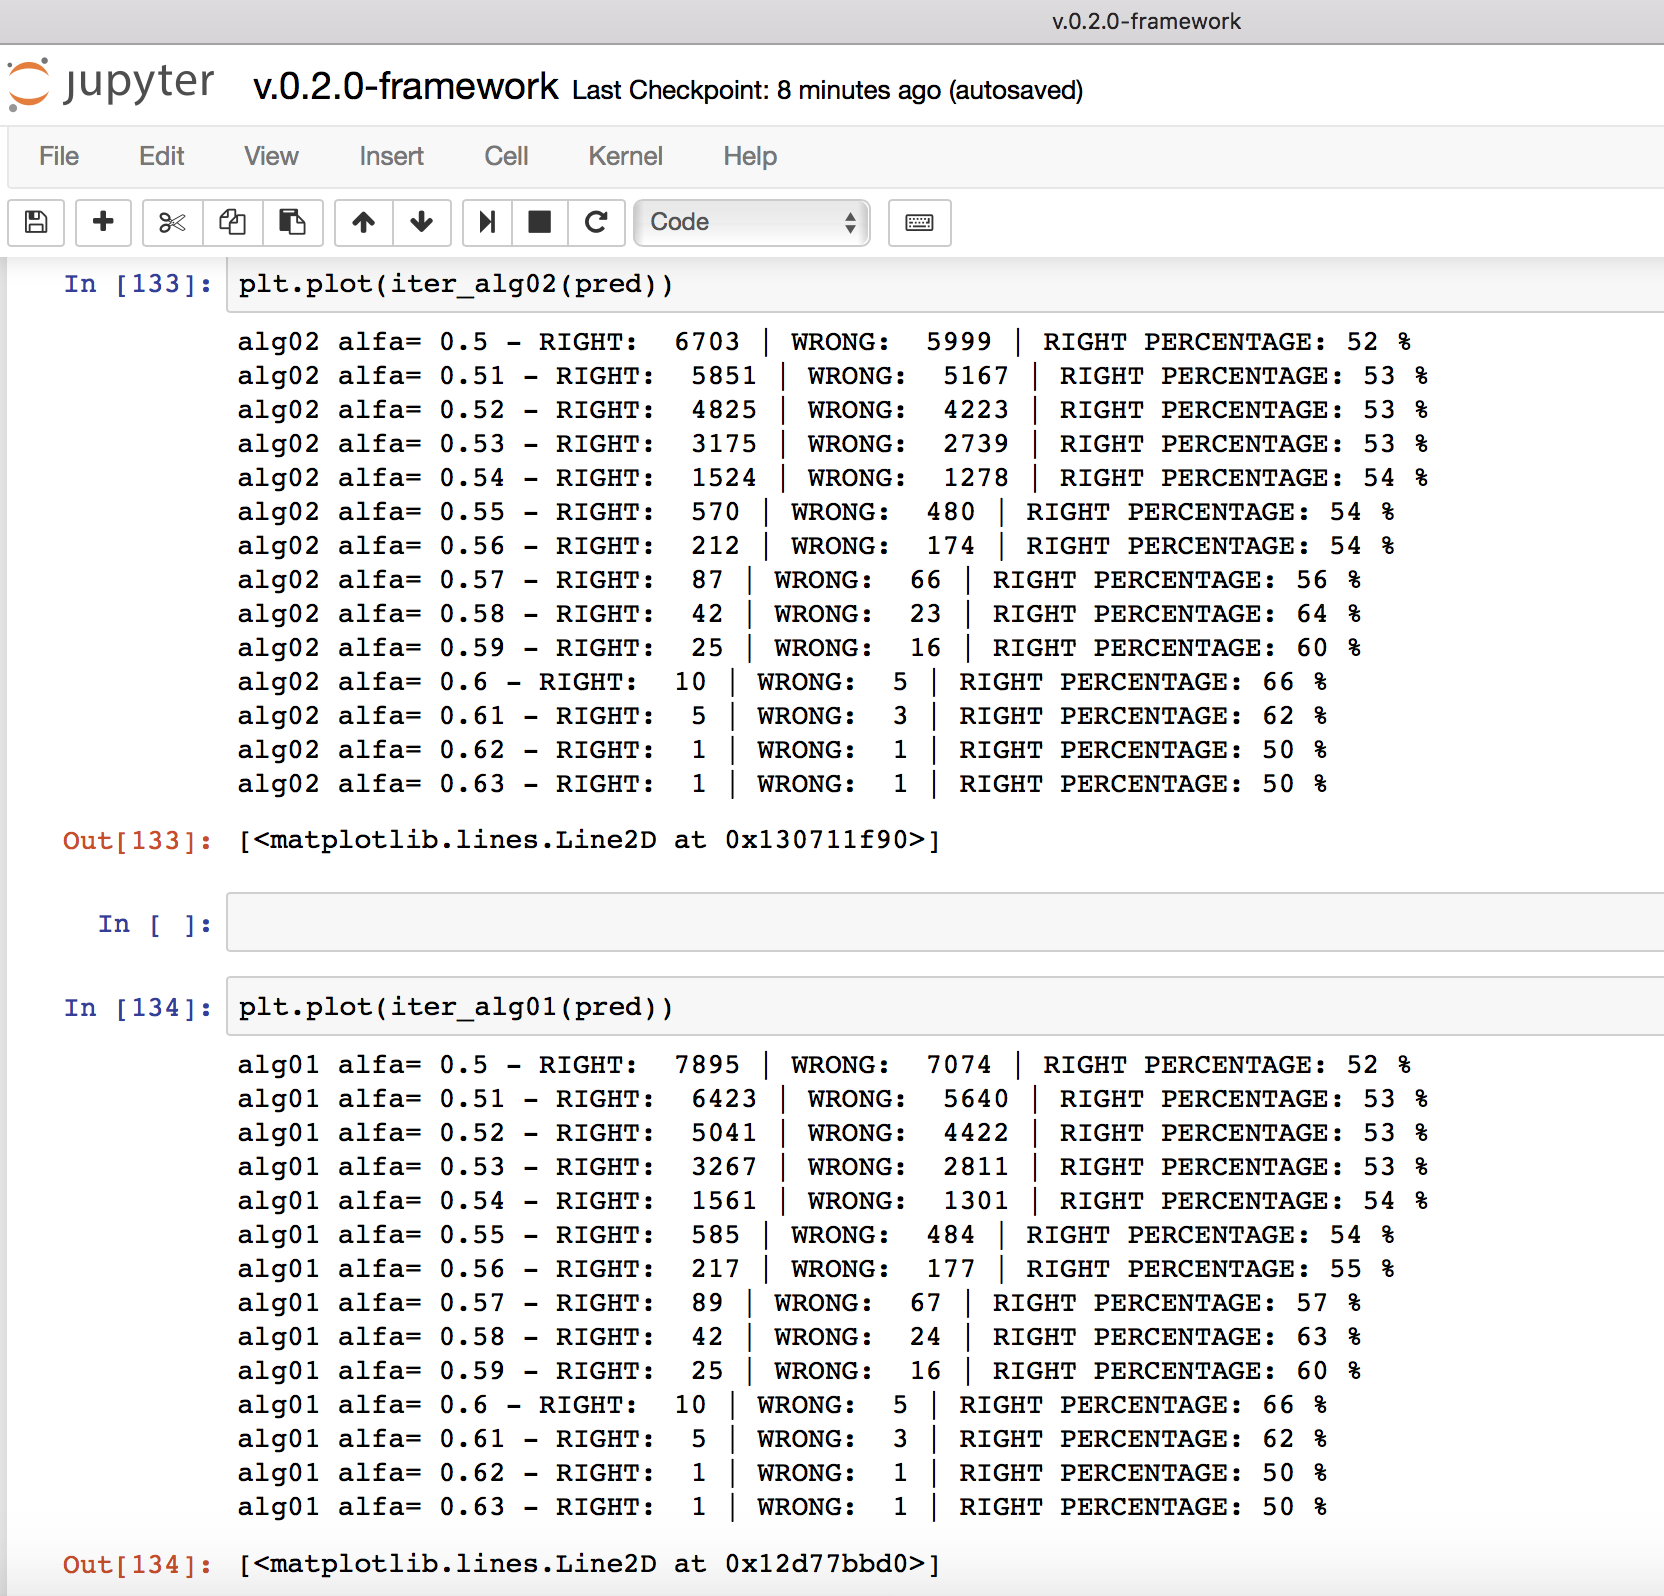
So here we have the outcome of our alfa-parametric trading algorithm that uses the Neural Network to predict prices, at alfa varying from 0.5 to 0.7 (as I sad alfa is how selective is the algorithm is in picking predictions from the NN). Here are the characteristics we can observe working with large dataset:
- Good consistentcy of results: the result are consistent and the predictive accuracy increase linearly with the alfa parameter varying uniformly from 52% to 60%
- Good number of results: we see that the number of
prediction is high even with higher alfa scenario, for instance
alfa=0.55 we have a 54%-56% accuracy with 570 right predictions and 480
wrong predictions
- Good accuracy of results: the accuracy right now is varying from 52% to 65% that is already an excellent result from a trading point of view (binary options have a break even point of 52%). Keep in mind that we are still using a very basic model, that is binary classification CNN, and I am confident that this result will be improved a lot with an RNN (GRU or LSTM) multi-classification model in the next implementations of the framework
Ok great, I think we are getting closer and closer to a real trading strategy, but first I want to try to implement a couple of other ideas I had with Forex data. I was thinking that what the NN is good at is getting the patterns in the price movement and becoming able to 'continue' a sequence of prices following the patterns it learned; actually this is not exactly 'predicting' or 'forecasting' the future prices. Why is it? Because the movement of prices not always follow the usual patterns (highly volatilty periods or short-term noise/oscillations). So if we want to actually 'predict' prices movement we should filter the predictions of the NN only to some specific period of time, when the market is not volatile or sensible to short-term oscillations for instance. Here are a couple of ideas I got on how to improve on this side.
- Maybe new timeframes,
Predicting on longer/different time frames, so this should be effective because of the Brownian motion (noise). The prices has some noise/random/Brownian motion that can not be predicted, but eliminated this noise what emerges are the patterns. How to do it? Instead of ask the NN if the price of tomorrow will be higher/lower than today we can ask her if the price of next week will be higher/lower than today (reference to the intuition I had still at the time of predicting GOOGL)
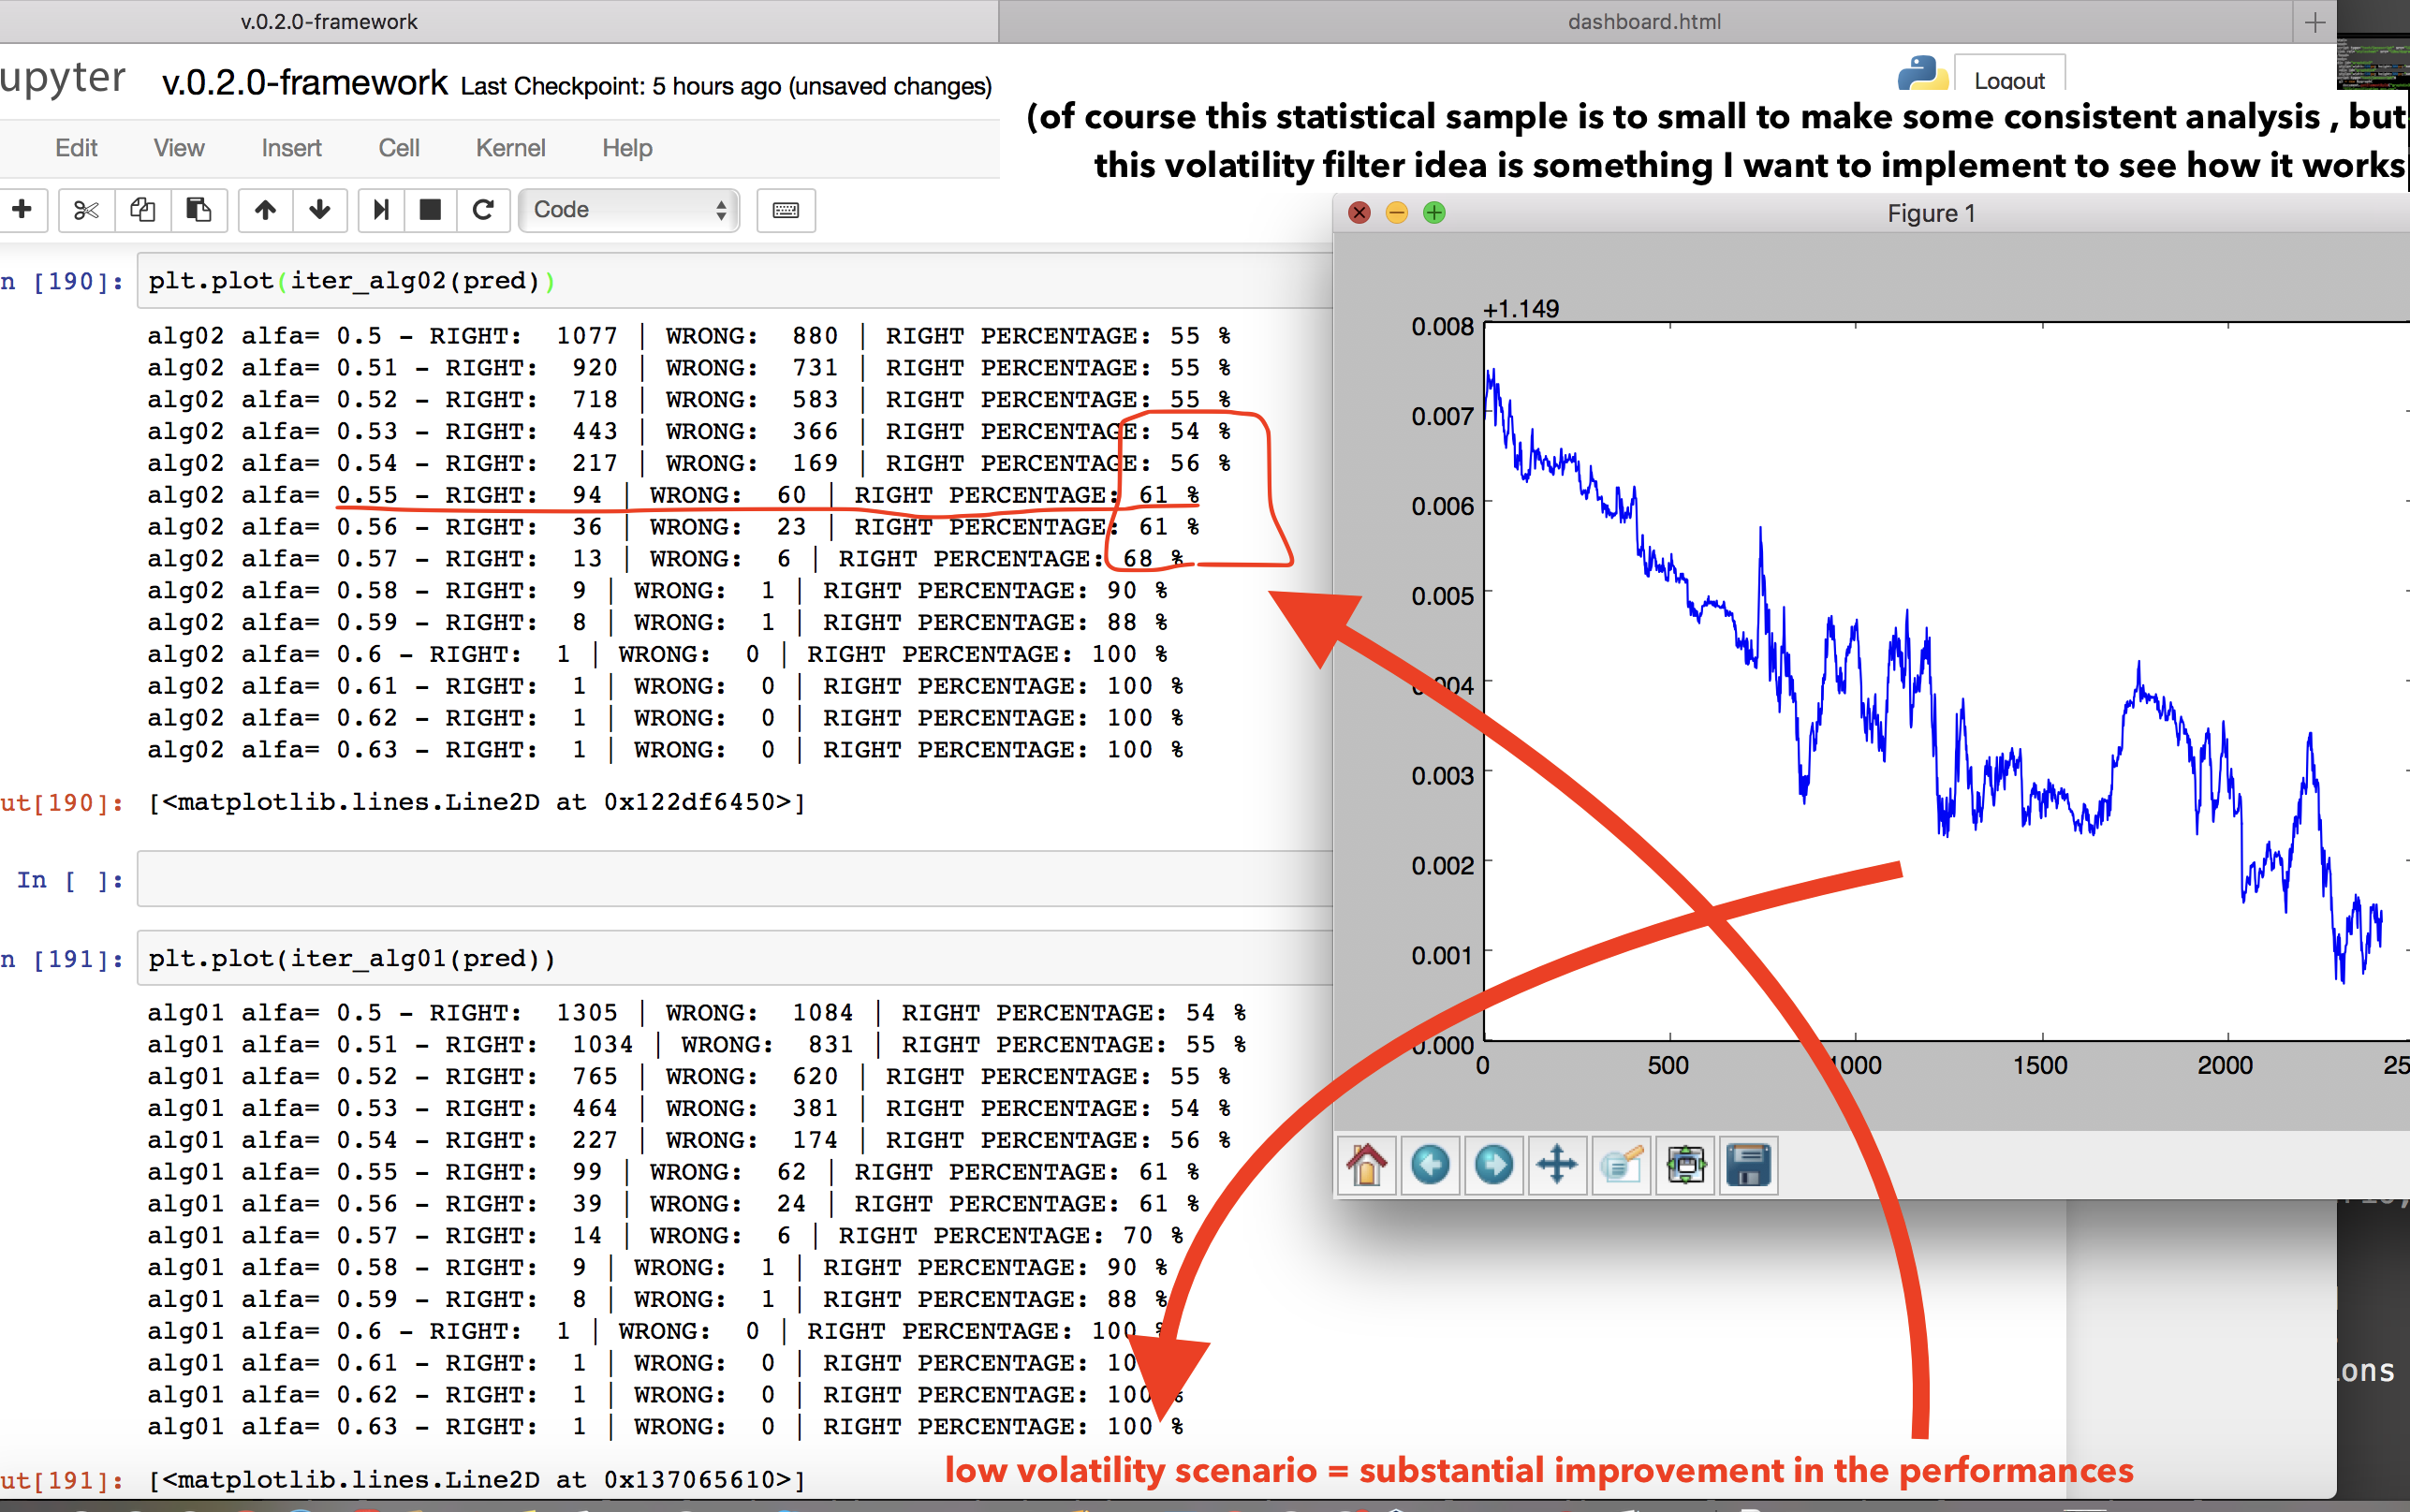
- And also new filters.
Applying some volatility filter to the predictions. Ok this is a new idea. So playing around with my charts and neural networks I saw that in periods when the market is really volatilty the prediction performance of my dear NN decline sharply. Why is that? Clearly the market is volatile is losing the regular patterns it follows usually. So what we should do is something like this: take the NN prediction and filter them picking the prediction of the low-volatility periods, if the volatilty goes up we stop listening to the NN and we just wait the market to calm down. How to do it? Well, just compute some associateed volatility index with our instrument and put a basic filter to our trading algorithm based on that. Sounds reasonable. What could be even more interesting would be make some machine learning inference about which kind of market situtation our NN is better at predicting and which kind of market is worse, and after that implement some ML filters on the algo. Cool. But I need to proceed one step at a time.
Day 7 - Buliding an algorithmic trading software
NOTE: I will not go into so much detail on this part, since is not related with the topic of this REPO, but I want to document it since is an important step in applying NN to a real world problem like financial predictions
I need to choose a broker to trade automatically binary options, maybe with some API: there is not. On the market of algo trading the big guys are OANDA, METATRADER, or QUANTOPIAN (start-up like) but they don't usually provide access to option. So I found a reliable broker with a incredibily high payout of 90% that I will call broker X. So we need a source for live-data feed for forex price and we need to automate
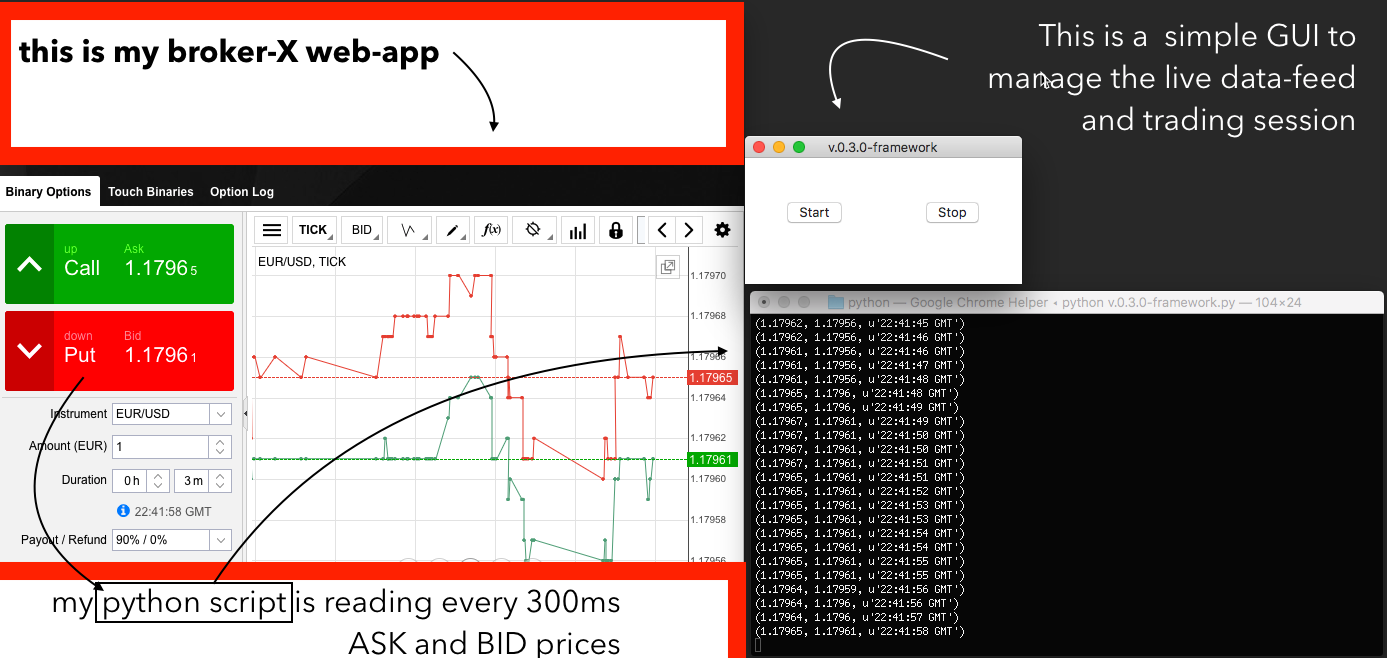
So I checked some option for live-data feed (like 1forge) but they are expensive and with limited volumes, I got a better idea: I can write a python script that dynamically parse the html of the web application from my broker, this way I will have a live data feed directly from the trading web-app I will need to send my order too (yes of course I will automate that too)
Couple of hours have passed, I have a first draft of my framework v-0.3.0. I used some python libraries to build a basic multi-threading GUI to manage the framework (Tkinter e Threading), so that I can start and stop the my trading application, and I used some other libraries (Selenium + PhantomJS) to dynamically parse the web-app of my broker X. Recap, why do I want to parse the html every N seconds? First because I want to have a live-data feed (reading the ASK and BID value) and second because I need to automatically send my order from brokerX web-app. I know I could find maybe some better infrastructure with API and everything but this will do for the first trials. So here is a screenshot from my framework-v.0.3.0 running
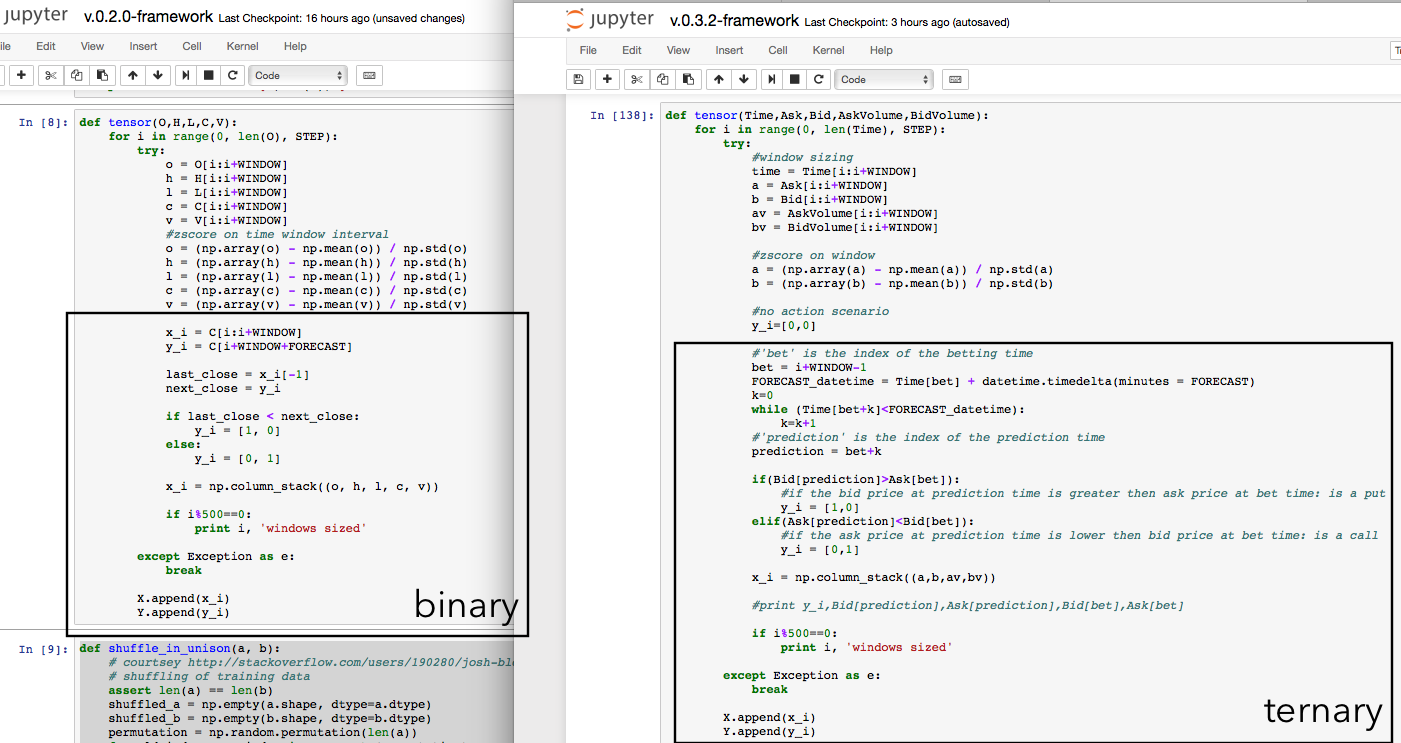
Day 8 - Binary to Ternary
I have been exploring many (over 13) different brokers for binary
options out there. It turned out that the problem is not so simple as I
thought at the start. The outcome is not binary, but is ternary. You
don't have just have 'price goes up' or 'price goes down'. You need to
take into account the fundamental concept of ask, bid and spread.
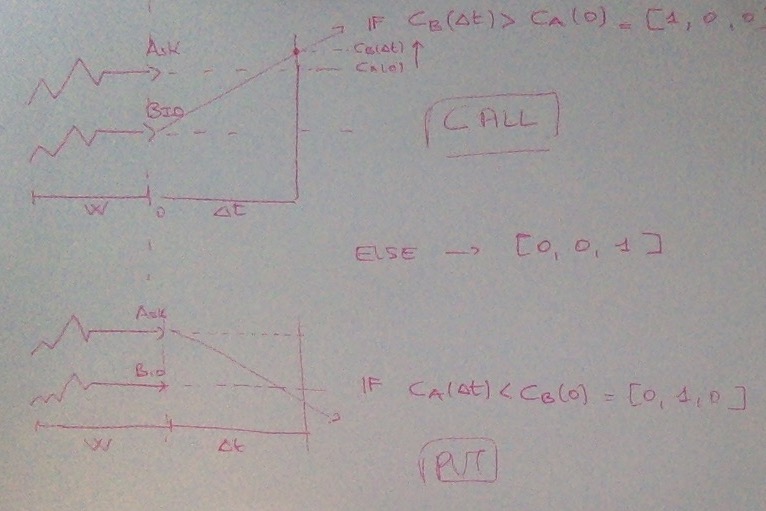
You win a 'call' if and only if the BID price at the prediction time is
higher than the ASK price at the betting time, and viceversa for a
'put'. This is obviously killing our probability. I need to rewrite the
framework in a Ternary fashion: [1,0,0] Call - [0,1,0] Put - [0,0,1]
Nothing (because the price doesn't move more than the spread between ask
and bid).
 So I rewrote the framework implementing the ASK-BID-SPREAD mechanism, the problem is that this way my winning rate goes down sharply.
I am still using 'tick' data on FOREX (a new data every 0.1s for
EUR/USD) and I am playing around with timeframes. I saw that using
bigger dataset here kind of worsen my performance? Why is that? probably
tick prices goes with different distributions in different weeks. In
the same time I am writing slightly more complex trading algo since the
ternary structure, considering the difference between the probability
for the event [1,0,0] and the probabilty for the event [0,1,0]. I remain
positive since my NN is still learning at a good rate, even if the
accuracy power is lower. (is lower since now we have to predict 1
outcome out of 3). Right now I am getting a 45-50% percent accuacy for
CALL and PUT events.
So I rewrote the framework implementing the ASK-BID-SPREAD mechanism, the problem is that this way my winning rate goes down sharply.
I am still using 'tick' data on FOREX (a new data every 0.1s for
EUR/USD) and I am playing around with timeframes. I saw that using
bigger dataset here kind of worsen my performance? Why is that? probably
tick prices goes with different distributions in different weeks. In
the same time I am writing slightly more complex trading algo since the
ternary structure, considering the difference between the probability
for the event [1,0,0] and the probabilty for the event [0,1,0]. I remain
positive since my NN is still learning at a good rate, even if the
accuracy power is lower. (is lower since now we have to predict 1
outcome out of 3). Right now I am getting a 45-50% percent accuacy for
CALL and PUT events.
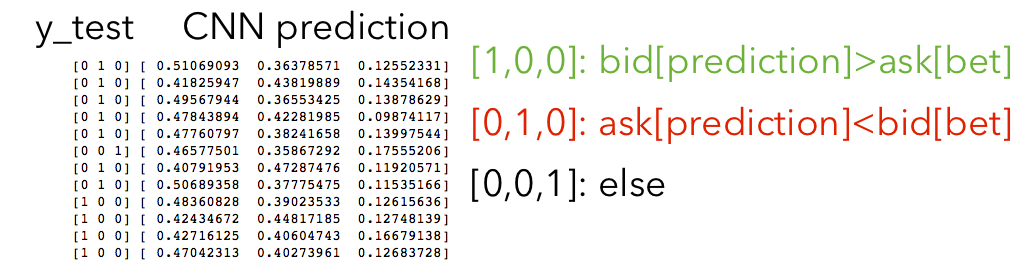 This is how the neural network works, she gives you back a vector
[p1,p2,p3] where p1 is the probability for event [1,0,0], p2 [0,1,0],
and p3 [0,0,1]. As I said right now the algorithms I am using to
implement a trading strategy on this new outcome is different, based on
the delta = abs(p1-p2) and a gamma = p3/mean(p3). Of course this is not a
structured trading algo but it will do for now.
What do I do now? Well I will continue to play around with the ternary
structure, I want to take smaller dataset to get the ticks from the
same probability distribution, I am currently predicting on a 3mins
forecast, and a 50ticks step between different time-windows. My priority
now is not to get the best result in terms of performance now, but is
to deploy the trading system to at least one broker platform with a demo
account, after that I will start to improve accuracy. I put my deadline
on next Tuesday (today is Sat) since here in Milan is holiday but the
stock markets are open and I can finally stay home during open hours of
the market (I am working in a hedge-fund right now).
note: I noticed I am writing the blog but I am not updating my code on
the repo, currently I am working on the framework v.0.3.2, I will do
something about it the next days ;)
This is how the neural network works, she gives you back a vector
[p1,p2,p3] where p1 is the probability for event [1,0,0], p2 [0,1,0],
and p3 [0,0,1]. As I said right now the algorithms I am using to
implement a trading strategy on this new outcome is different, based on
the delta = abs(p1-p2) and a gamma = p3/mean(p3). Of course this is not a
structured trading algo but it will do for now.
What do I do now? Well I will continue to play around with the ternary
structure, I want to take smaller dataset to get the ticks from the
same probability distribution, I am currently predicting on a 3mins
forecast, and a 50ticks step between different time-windows. My priority
now is not to get the best result in terms of performance now, but is
to deploy the trading system to at least one broker platform with a demo
account, after that I will start to improve accuracy. I put my deadline
on next Tuesday (today is Sat) since here in Milan is holiday but the
stock markets are open and I can finally stay home during open hours of
the market (I am working in a hedge-fund right now).
note: I noticed I am writing the blog but I am not updating my code on
the repo, currently I am working on the framework v.0.3.2, I will do
something about it the next days ;)
Day 9 - Ternary's side effects
Ok ternary is not going so good. Why is that? Have a look a these charts

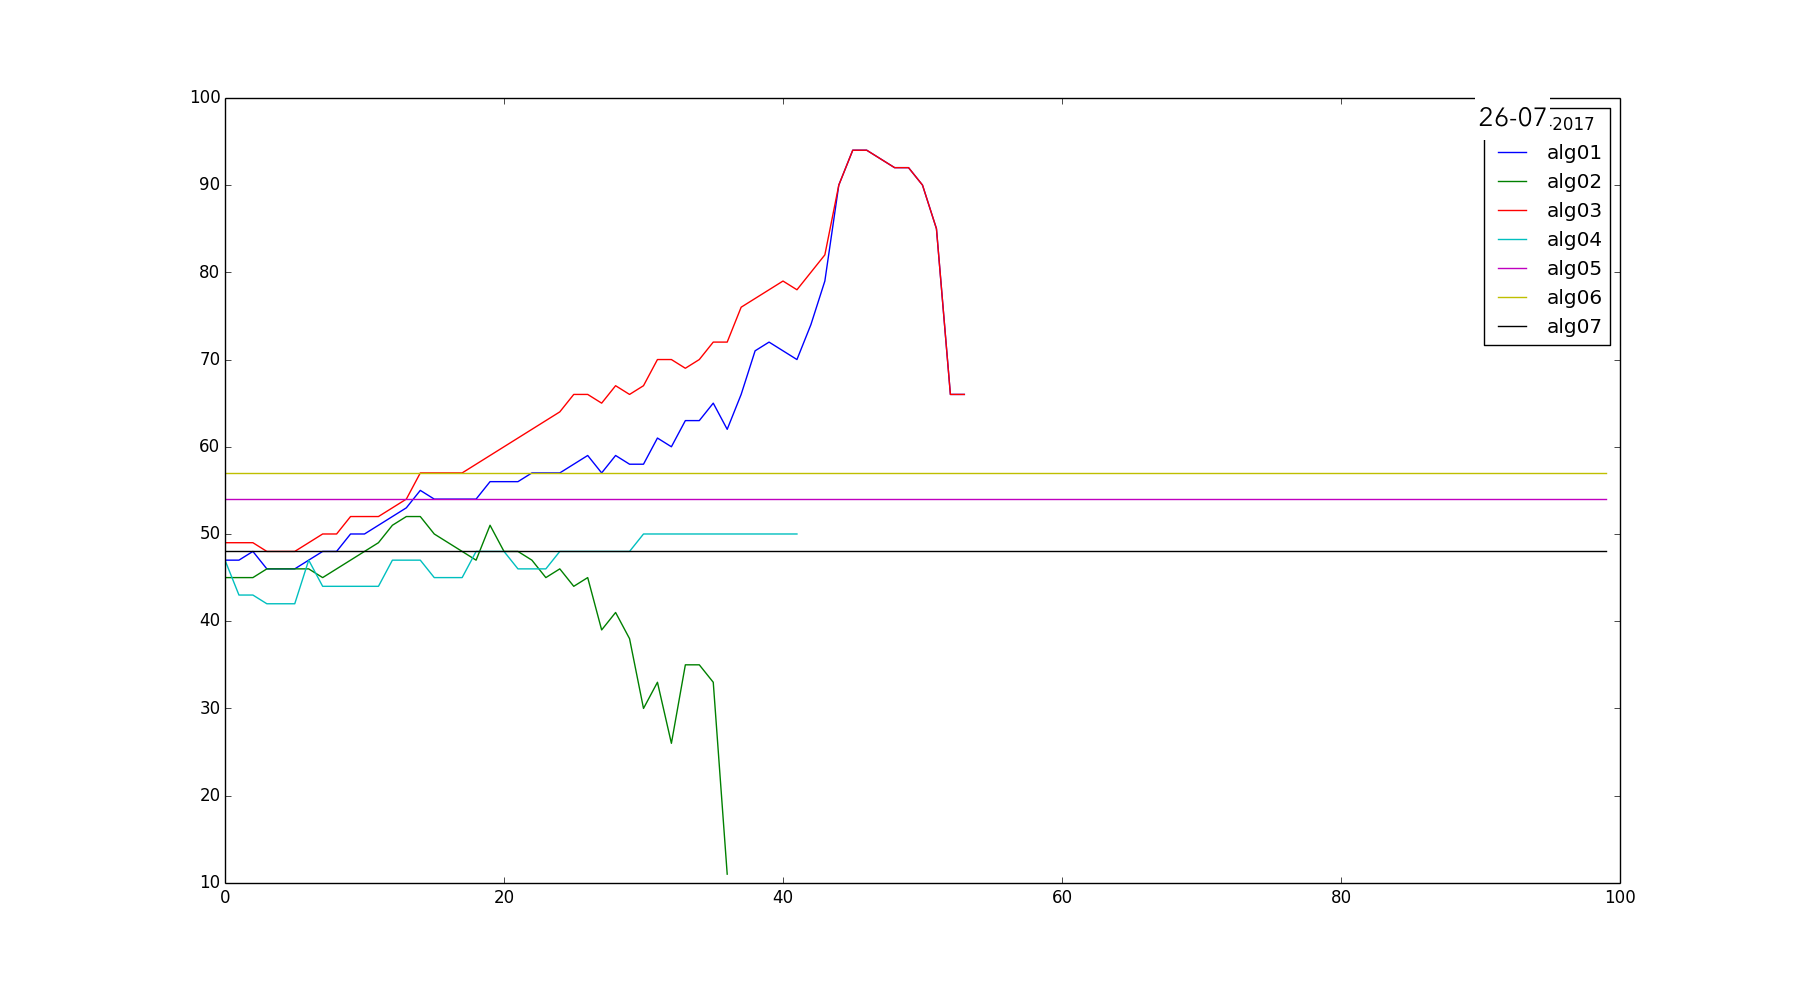
This is the performance of my seven different algorithms that work on the Neural Net predictions to trade the market. On the Y Axis there is the accuracy (right bets/total bets) and on the X Axis are the tuning parameters (4 algos out of 7 are parametric). So is it good? I am having a good 60-70% accuracy with algo-03 and algo-01, but the point that this is NOT good. Is not good because is quite random, it is not a reliable estimate: basically the algos perform good based on how much the training set and the testing set have the same trend. I know I am not using a large dataset, but even with weekly and monthly dataset using ternary classification the results are similar. So this is a recap about the classification strategy (post v.0.2) I used up to now.
- I started with binary, was going pretty good. I tried both with FOREX minute data and FOREX ticks data and I have healthy and positive results
- Bad news, binary classification is a lie: even if it's called binary is actually a ternary process. With BID ASK and SPREAD
- Trying to implement the ternary model the accuracy goes down sharply since now a 'random' guess gives a 33% accuracy and not a 50% accuracy like binary
- I wanna try not to use anymore the TICKS but the minute data (increasing the time frame I can neglet the outcome [0,0,1]) using a "soft-ternary" approach, and maybe applying some trend filters.
- If this doesn't work yet I will turn back to a 100% binary approach and I will think harder on the trading system to make a profit out of that anyway. (since the good NN results we got)
Ok a long day of coding has passed and maybe I found something good: I stayed with ternary system but I changed from ticks to minutes data. I increased my prediction time to 45 min and my window to 90 minutes (soft-ternary approach), training the CNN from 1 april to 1 july: I have been seeing increasingly good results with my algos (specifically the trend-based parametrics alg08 and alg09, with alfa=0.51). After the training of the CNN was done I gave the algos new data of about two weeks of trading of august and I got an astounding 67%-70% of average prediction accuracy. The result is positive and also healthy, since the testing of the algos was on fresh new data that the CNN never saw during the training. So how did I get this major improvement with ternary classification? Here is the answer
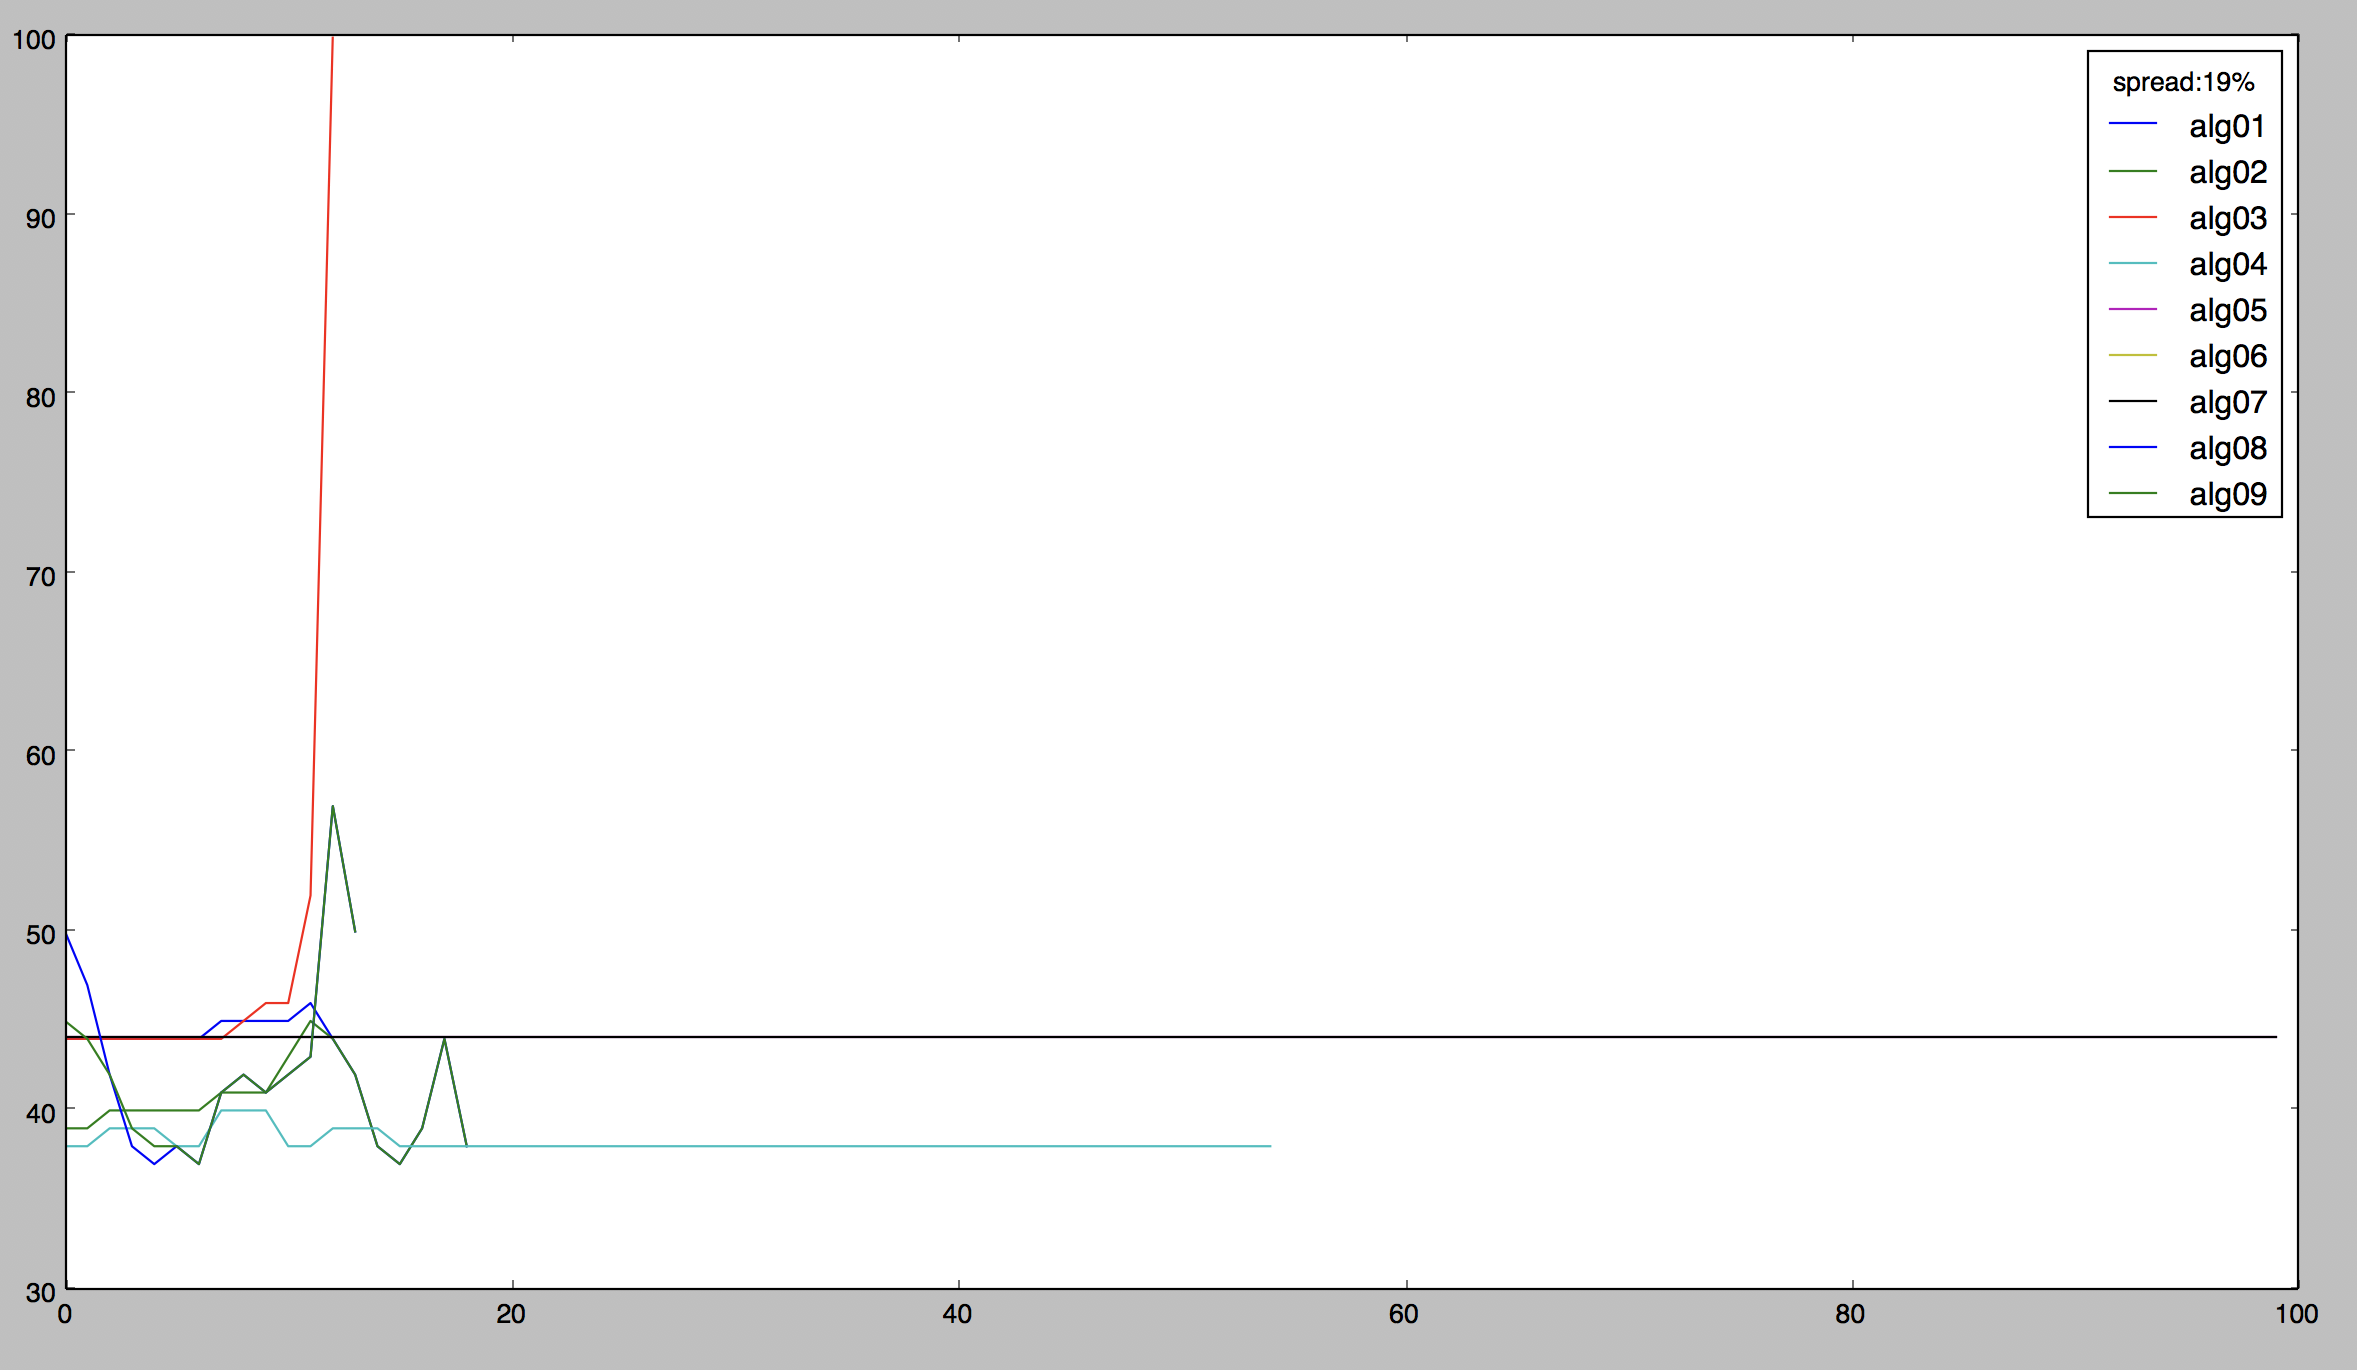
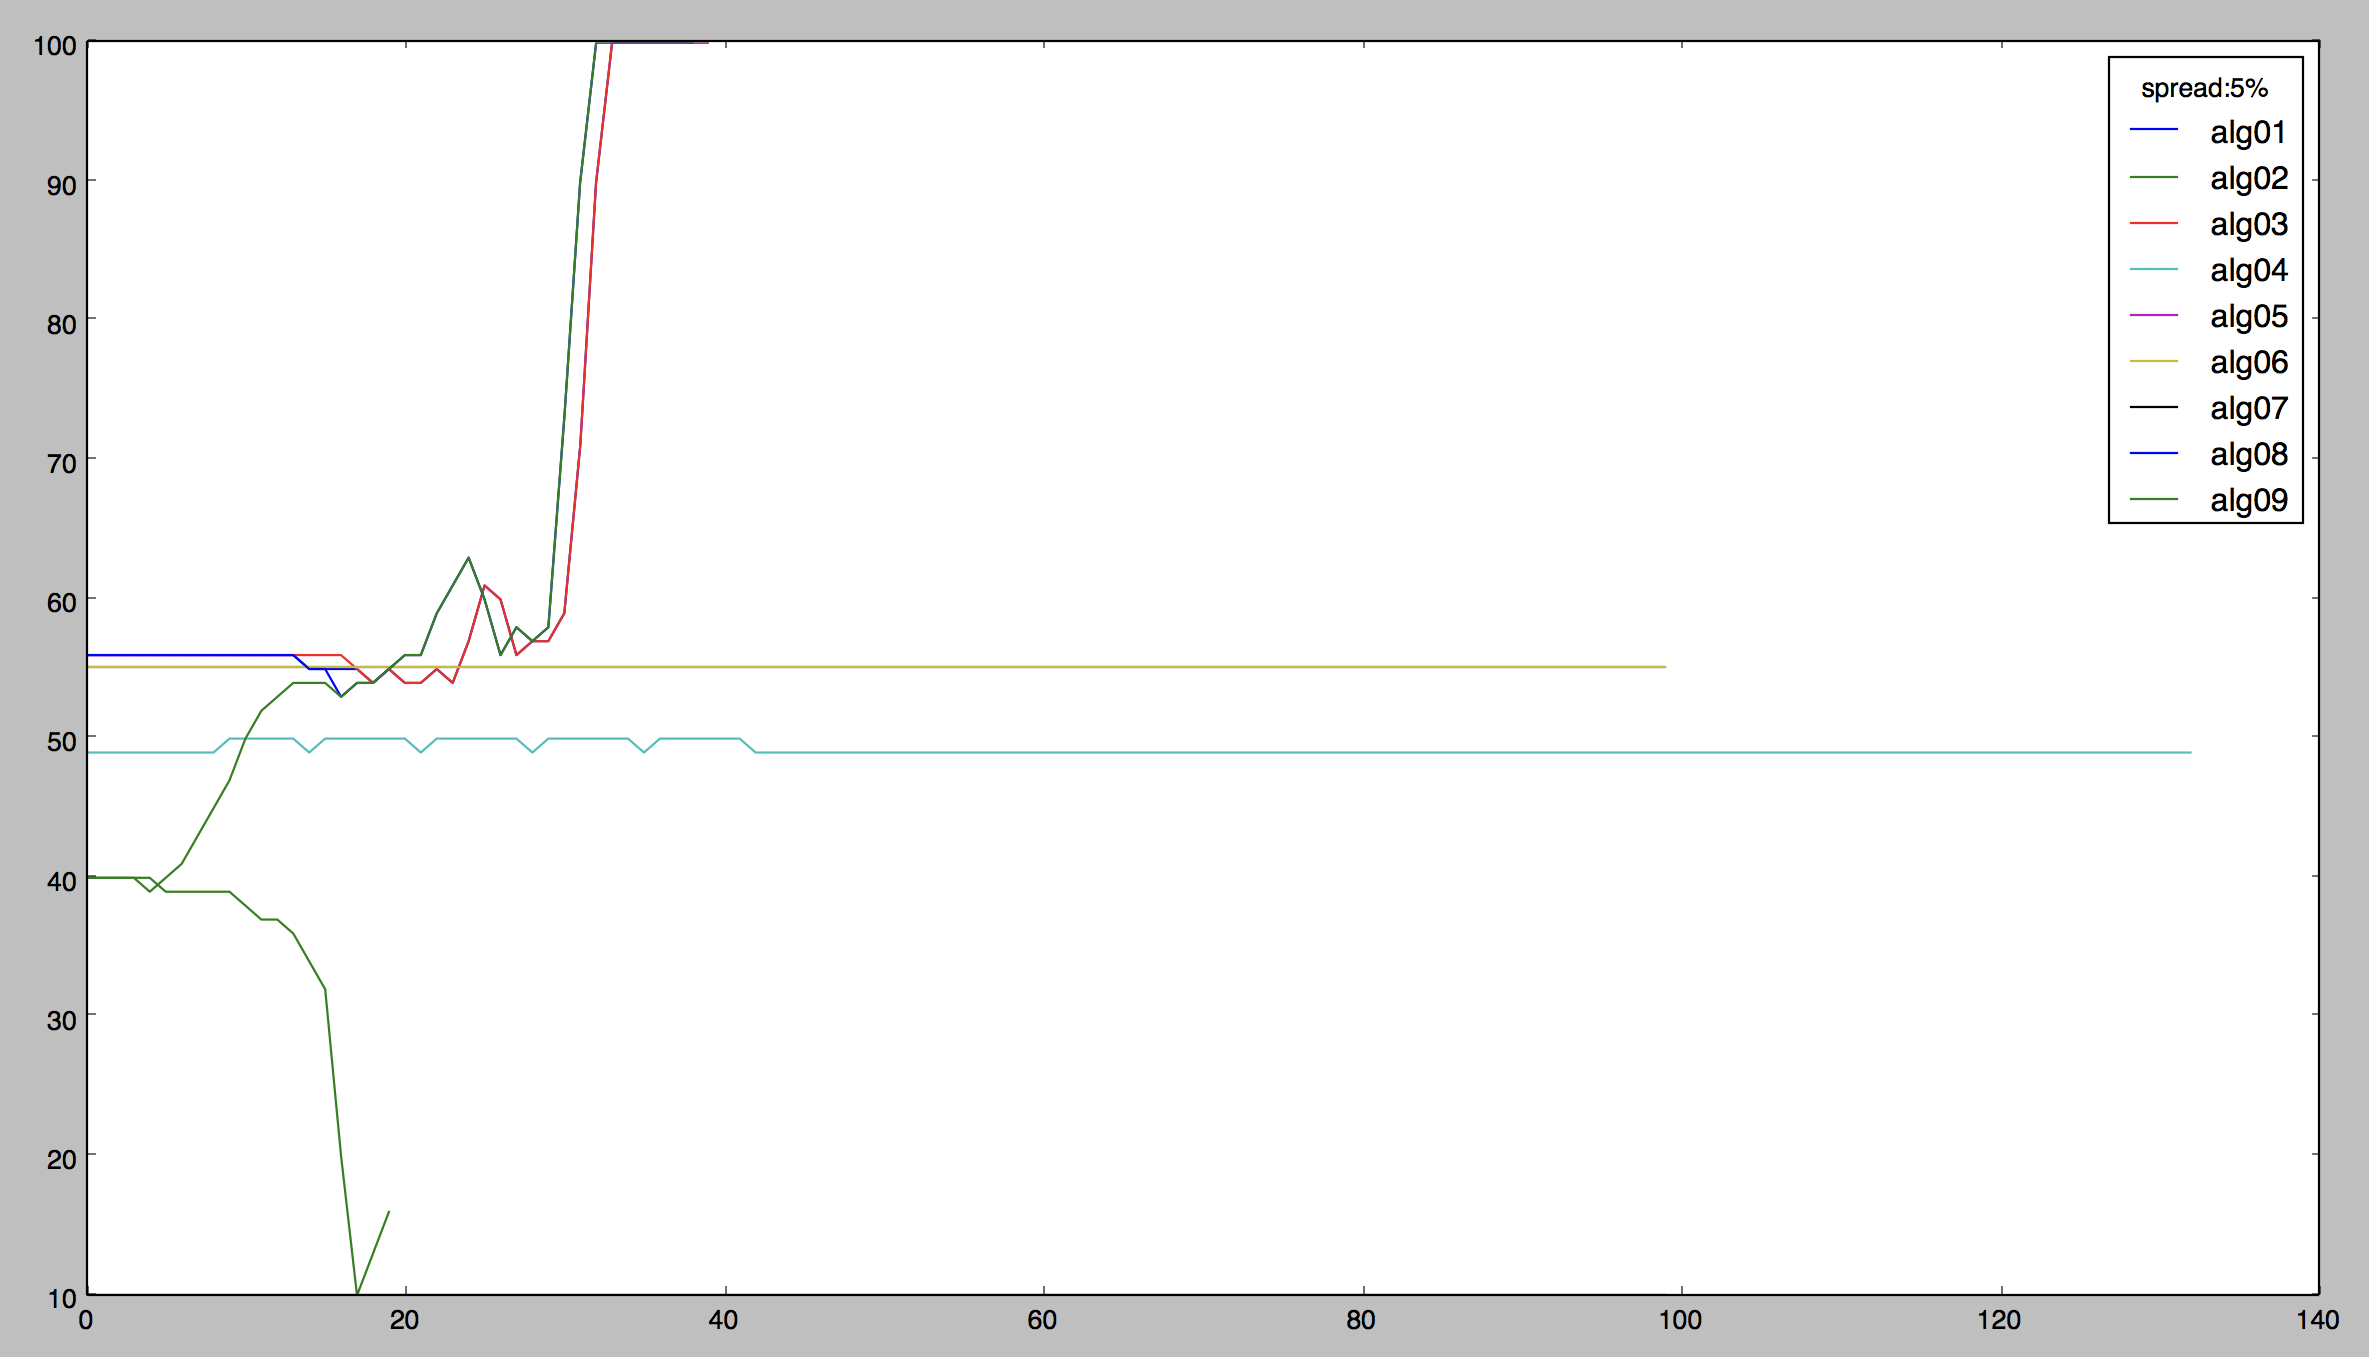
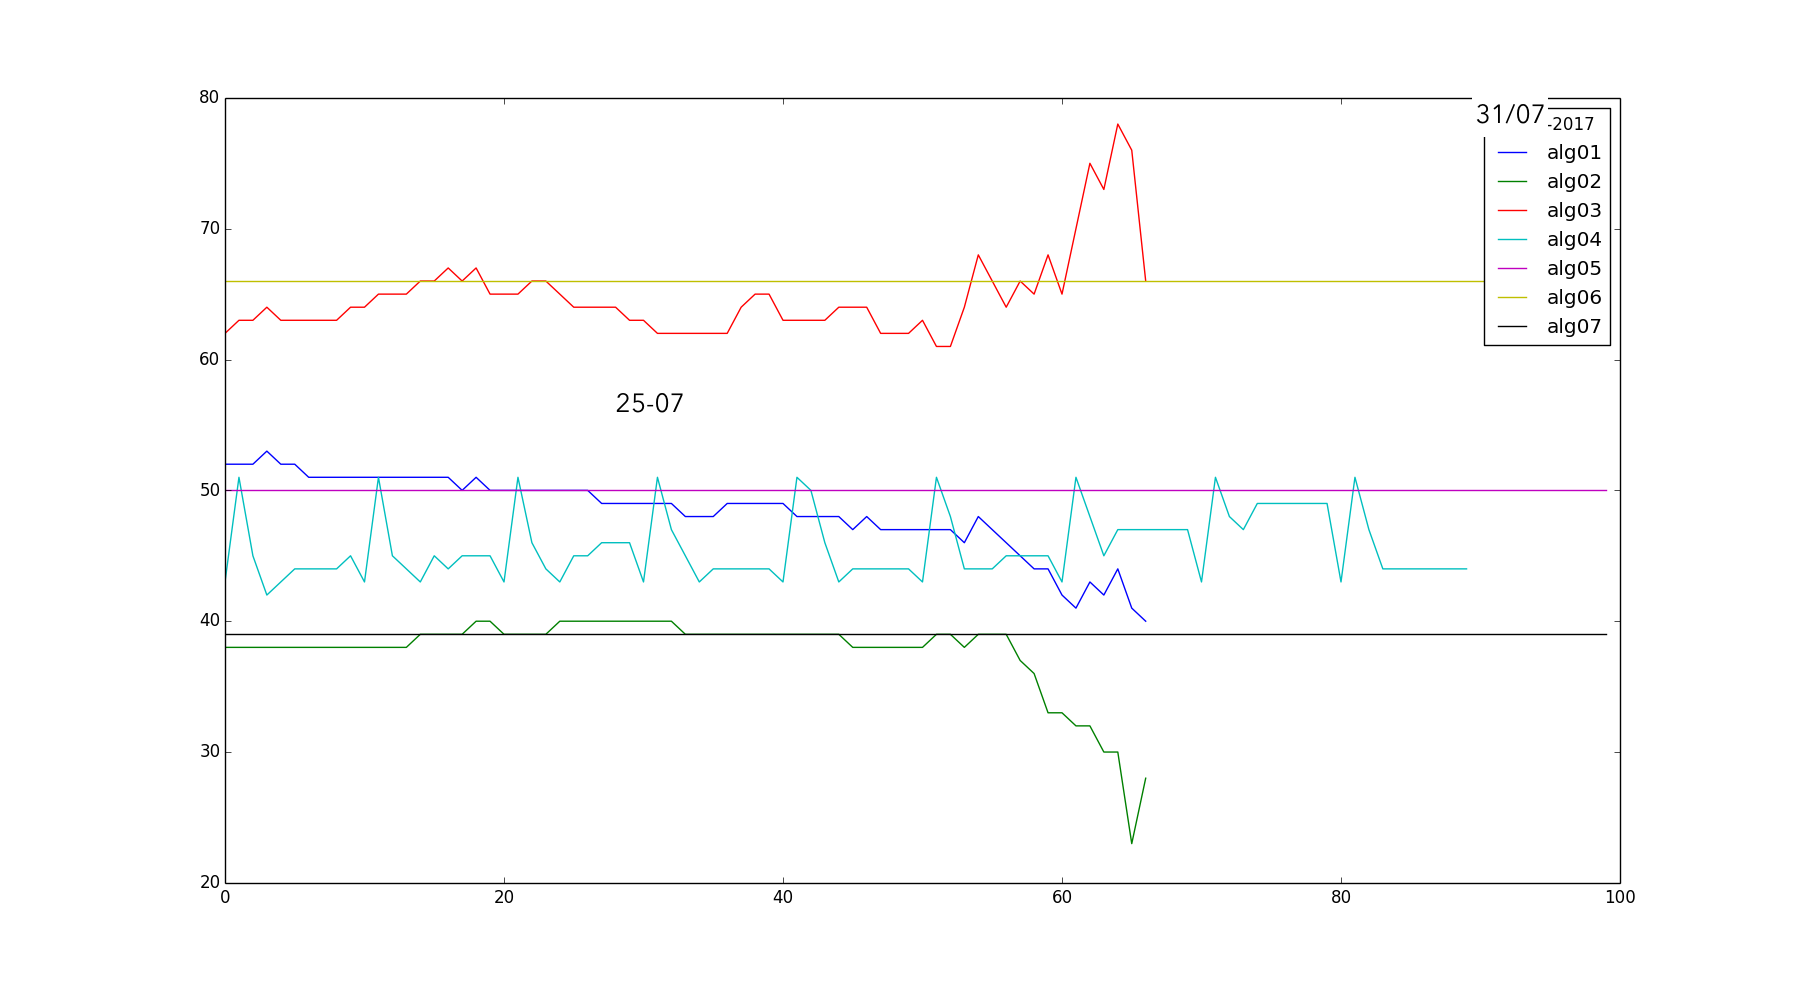
These are the charts of the performance of my algorithms (I wrote nine up to now) in two different 'spread' condition (you can read it in the legend on the upper right). With spread I mean the average number of time that the prices does not vary more than the spread (difference between bid and ask) during my prediction time, in a prediction-in-the-spread scenario I will always lose, no matter I do a put or a call. So the key to edge a ternary classification model is to make prediction on longer time frames (15mins, 30mins, 45mins) so that the prices oscillations will be big in respect to the spread. In the two charts above I used the exact same model but with different FORECAST values (5 mins for 19% spread and 20 mins for 5% spread). You can see how the performance of ALL the algorithms increases substantially.
So today I wrote a cleaner and more efficient version of the framework, and tomorrow I will probably produce better testing result for my apparently high-performance algorithm, we are getting closer to the deployment of the trading system!
NOTE: we are at version v.0.2.3 of the framework
Day 14 - the first week of algo trading with my CNN (v.0.4.0 )
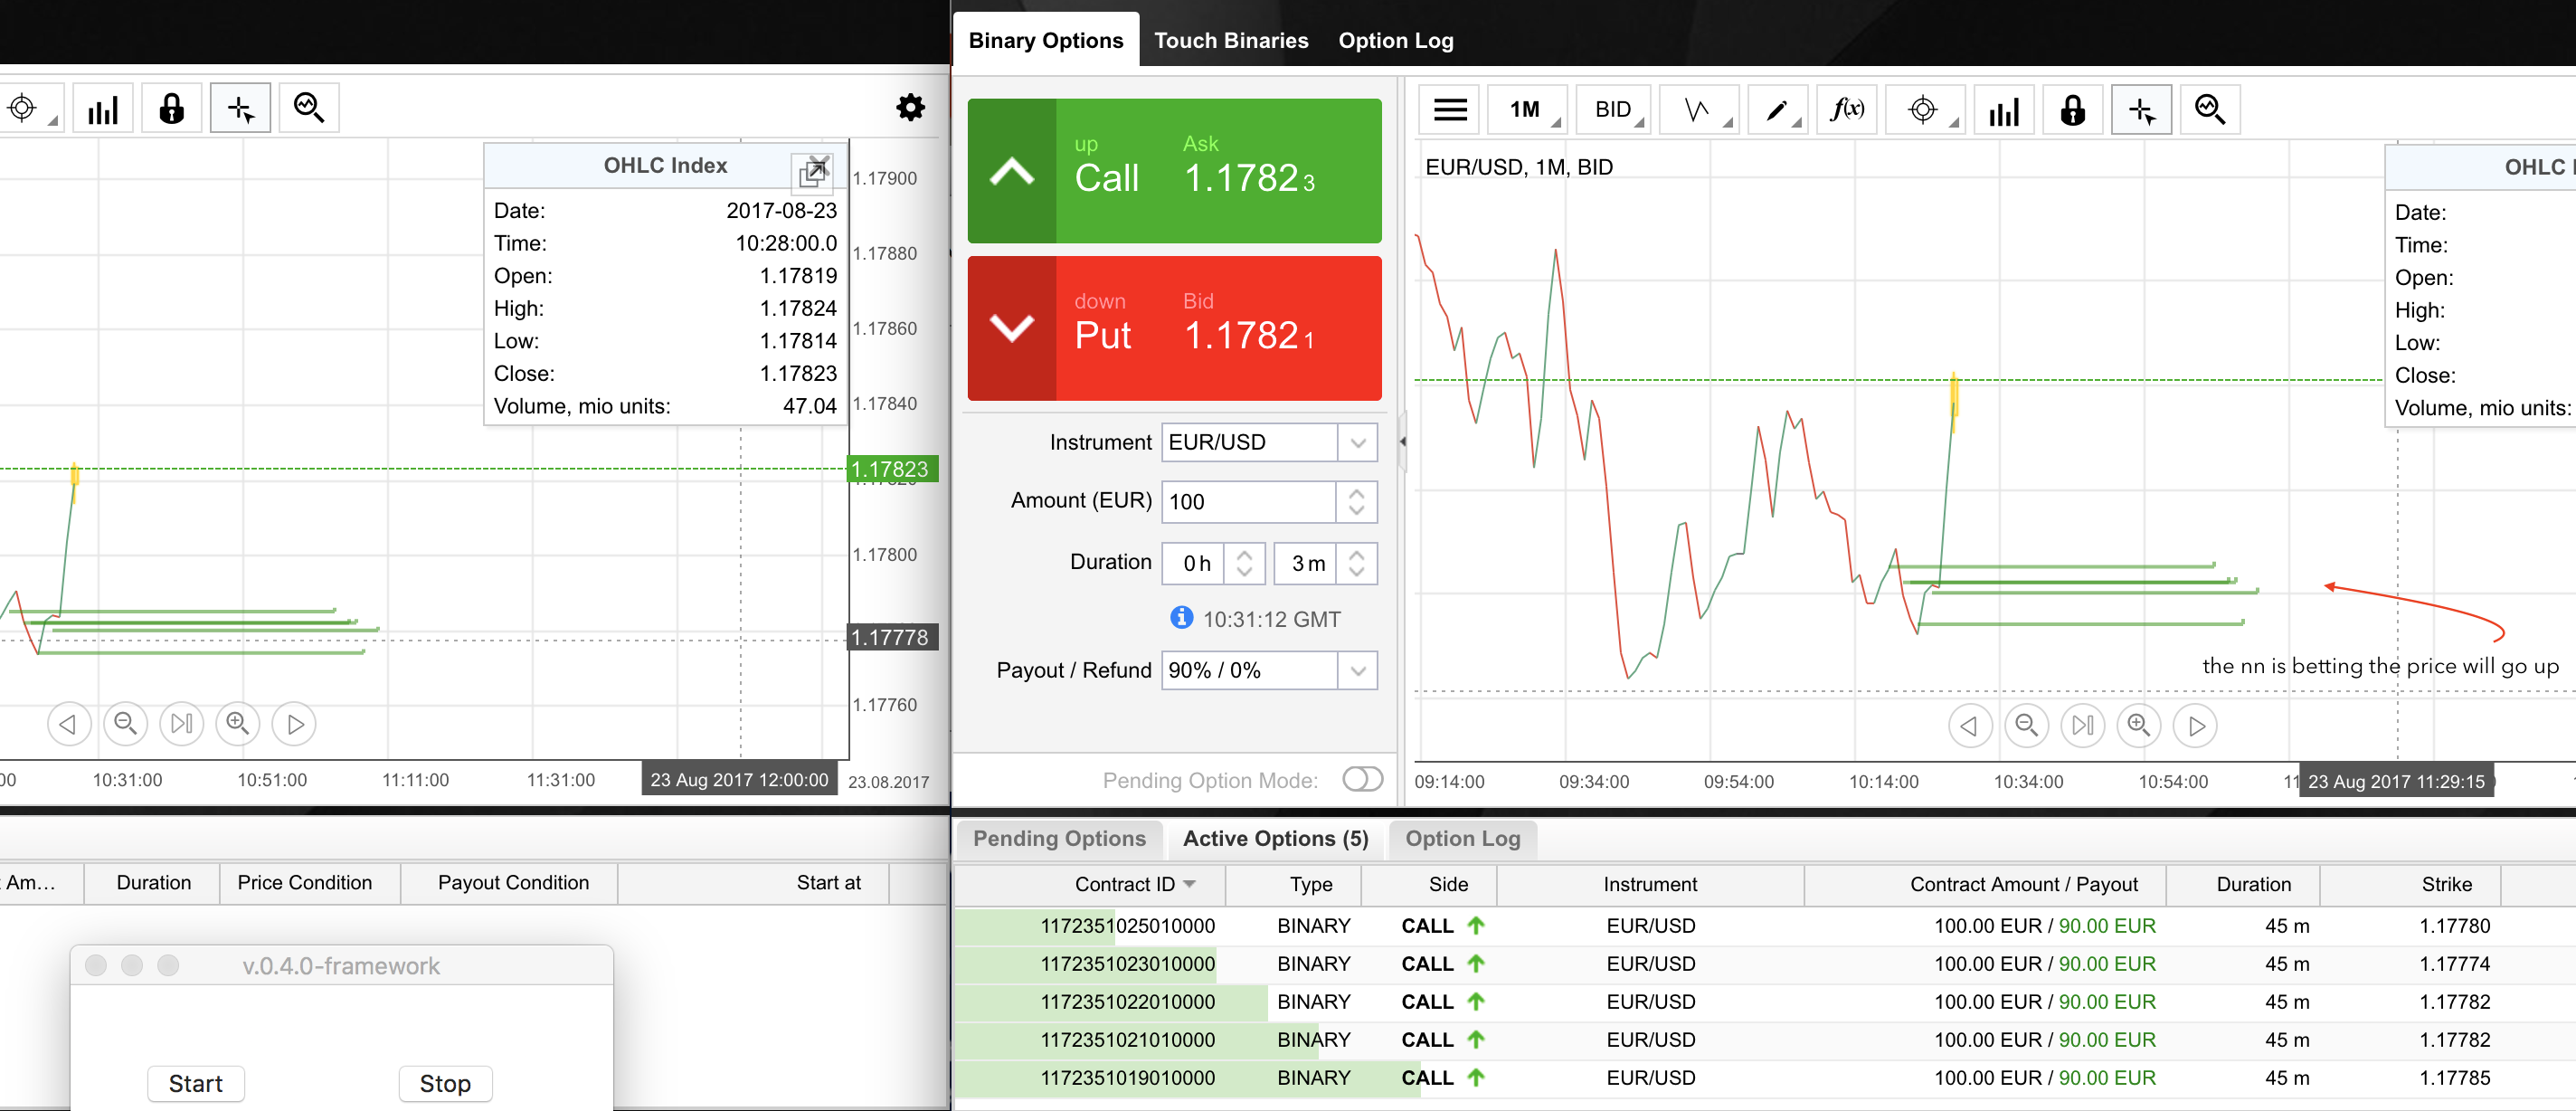
I hadn't written for a while. After the deployment of the algo trading strategy and the framework was solid enough I started running it on a broker demo account. The one-billion dollar question: did I make money? Yes. But life is not so easy. Long story short, this thing actually implements some profitable trading strategies BUT I still need to reduce dramatically the risk and volatilty of my returns. Let me break it down for you. So here is an overview of my framework-v.0.4.0 in action.
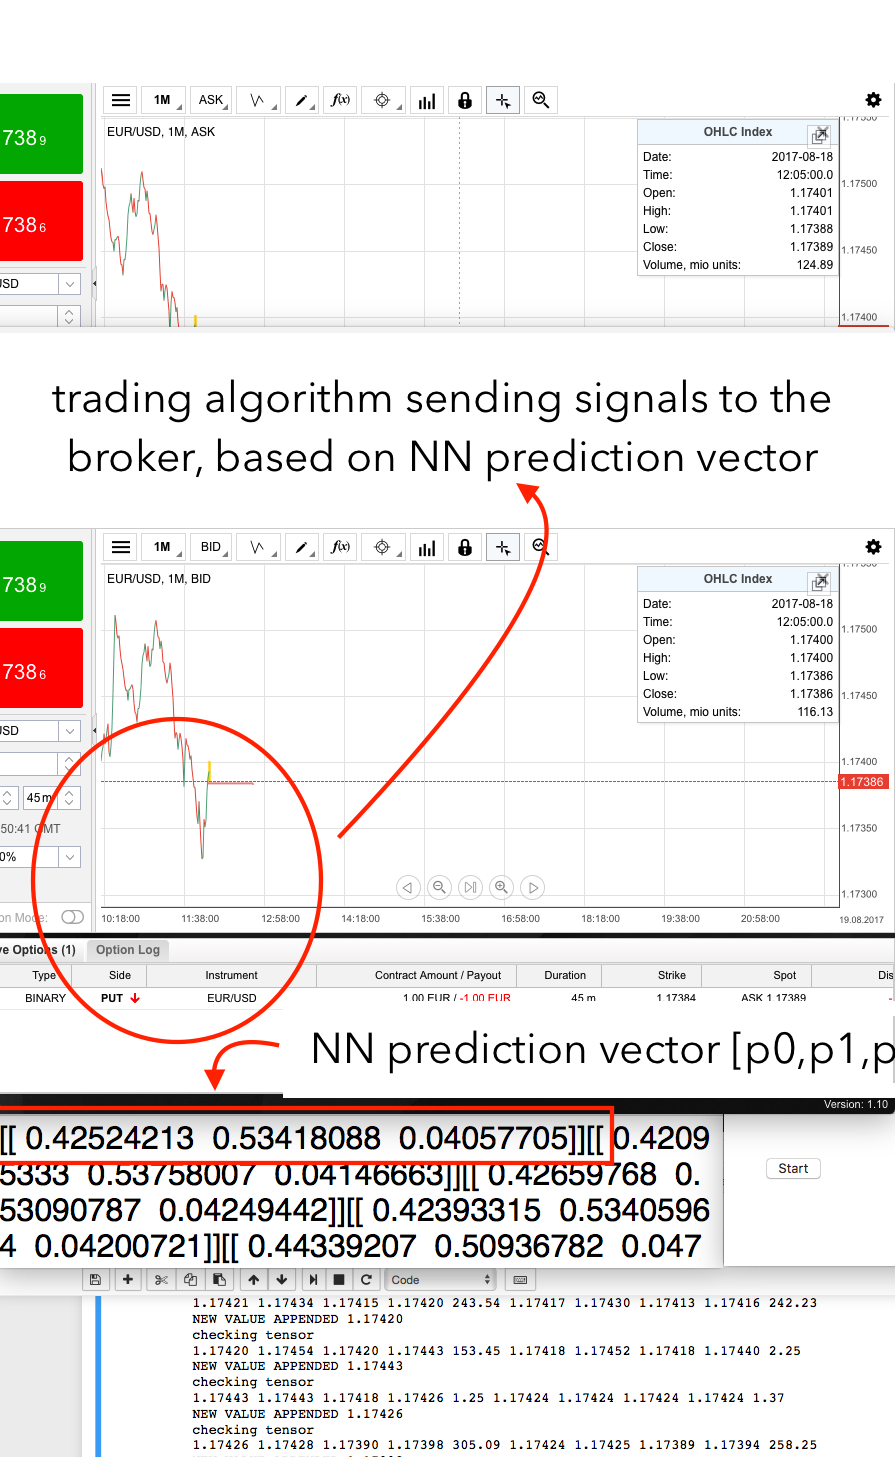
So here is how it works, the v.0.4.0 is ternary based so we need the ASK window and the BID window open to dynamically parse data. While the python script parses the data the NN is working on a parallel thread (yep I am using multi-threading) giving us the prediction for the next FORECAST time with a prediction array [p0,p1,p2]. Every time we have a prediction the algo (I am using the famous algo-08 with alfa=0.495 that gave me excellent performances on the test dataset) runs on the prediction array, and give me a signal: PUT, CALL, NOTHING. Once I have the signal I just send some scripting orders to my broker (using Selenium and BeautifulSoup) and I open my position. You can see in the picture a PUT has just been ordered.
So is this thing profitable? How much? Can I earn a living out of this?
Yes and no. The broker is giving me a break-even of 52% and during this
week I consistently mantained a winning-rate greater then 52%. But
after seeing my NN trading there is a strong necessity to improve on
reliablity and risk conteinance. After one week of observing long 10
hours live sessions (at my office) here are some things I noted
The Neural Network is working with some trend-inversion strategies. It seems to work in both senses (up and down) and likes to put many orders one after another. The first days it seemed that the NN was building her strategy on spotting prices not balanced compared to moving/ew averages. Not such a 'deep' strategy, and in my opionion also quite risky (never bet against a trend). Anyway, we never know what she is thinking so let her do. The real question was: is she using a strategy or just going almost random? I got the answer the second day
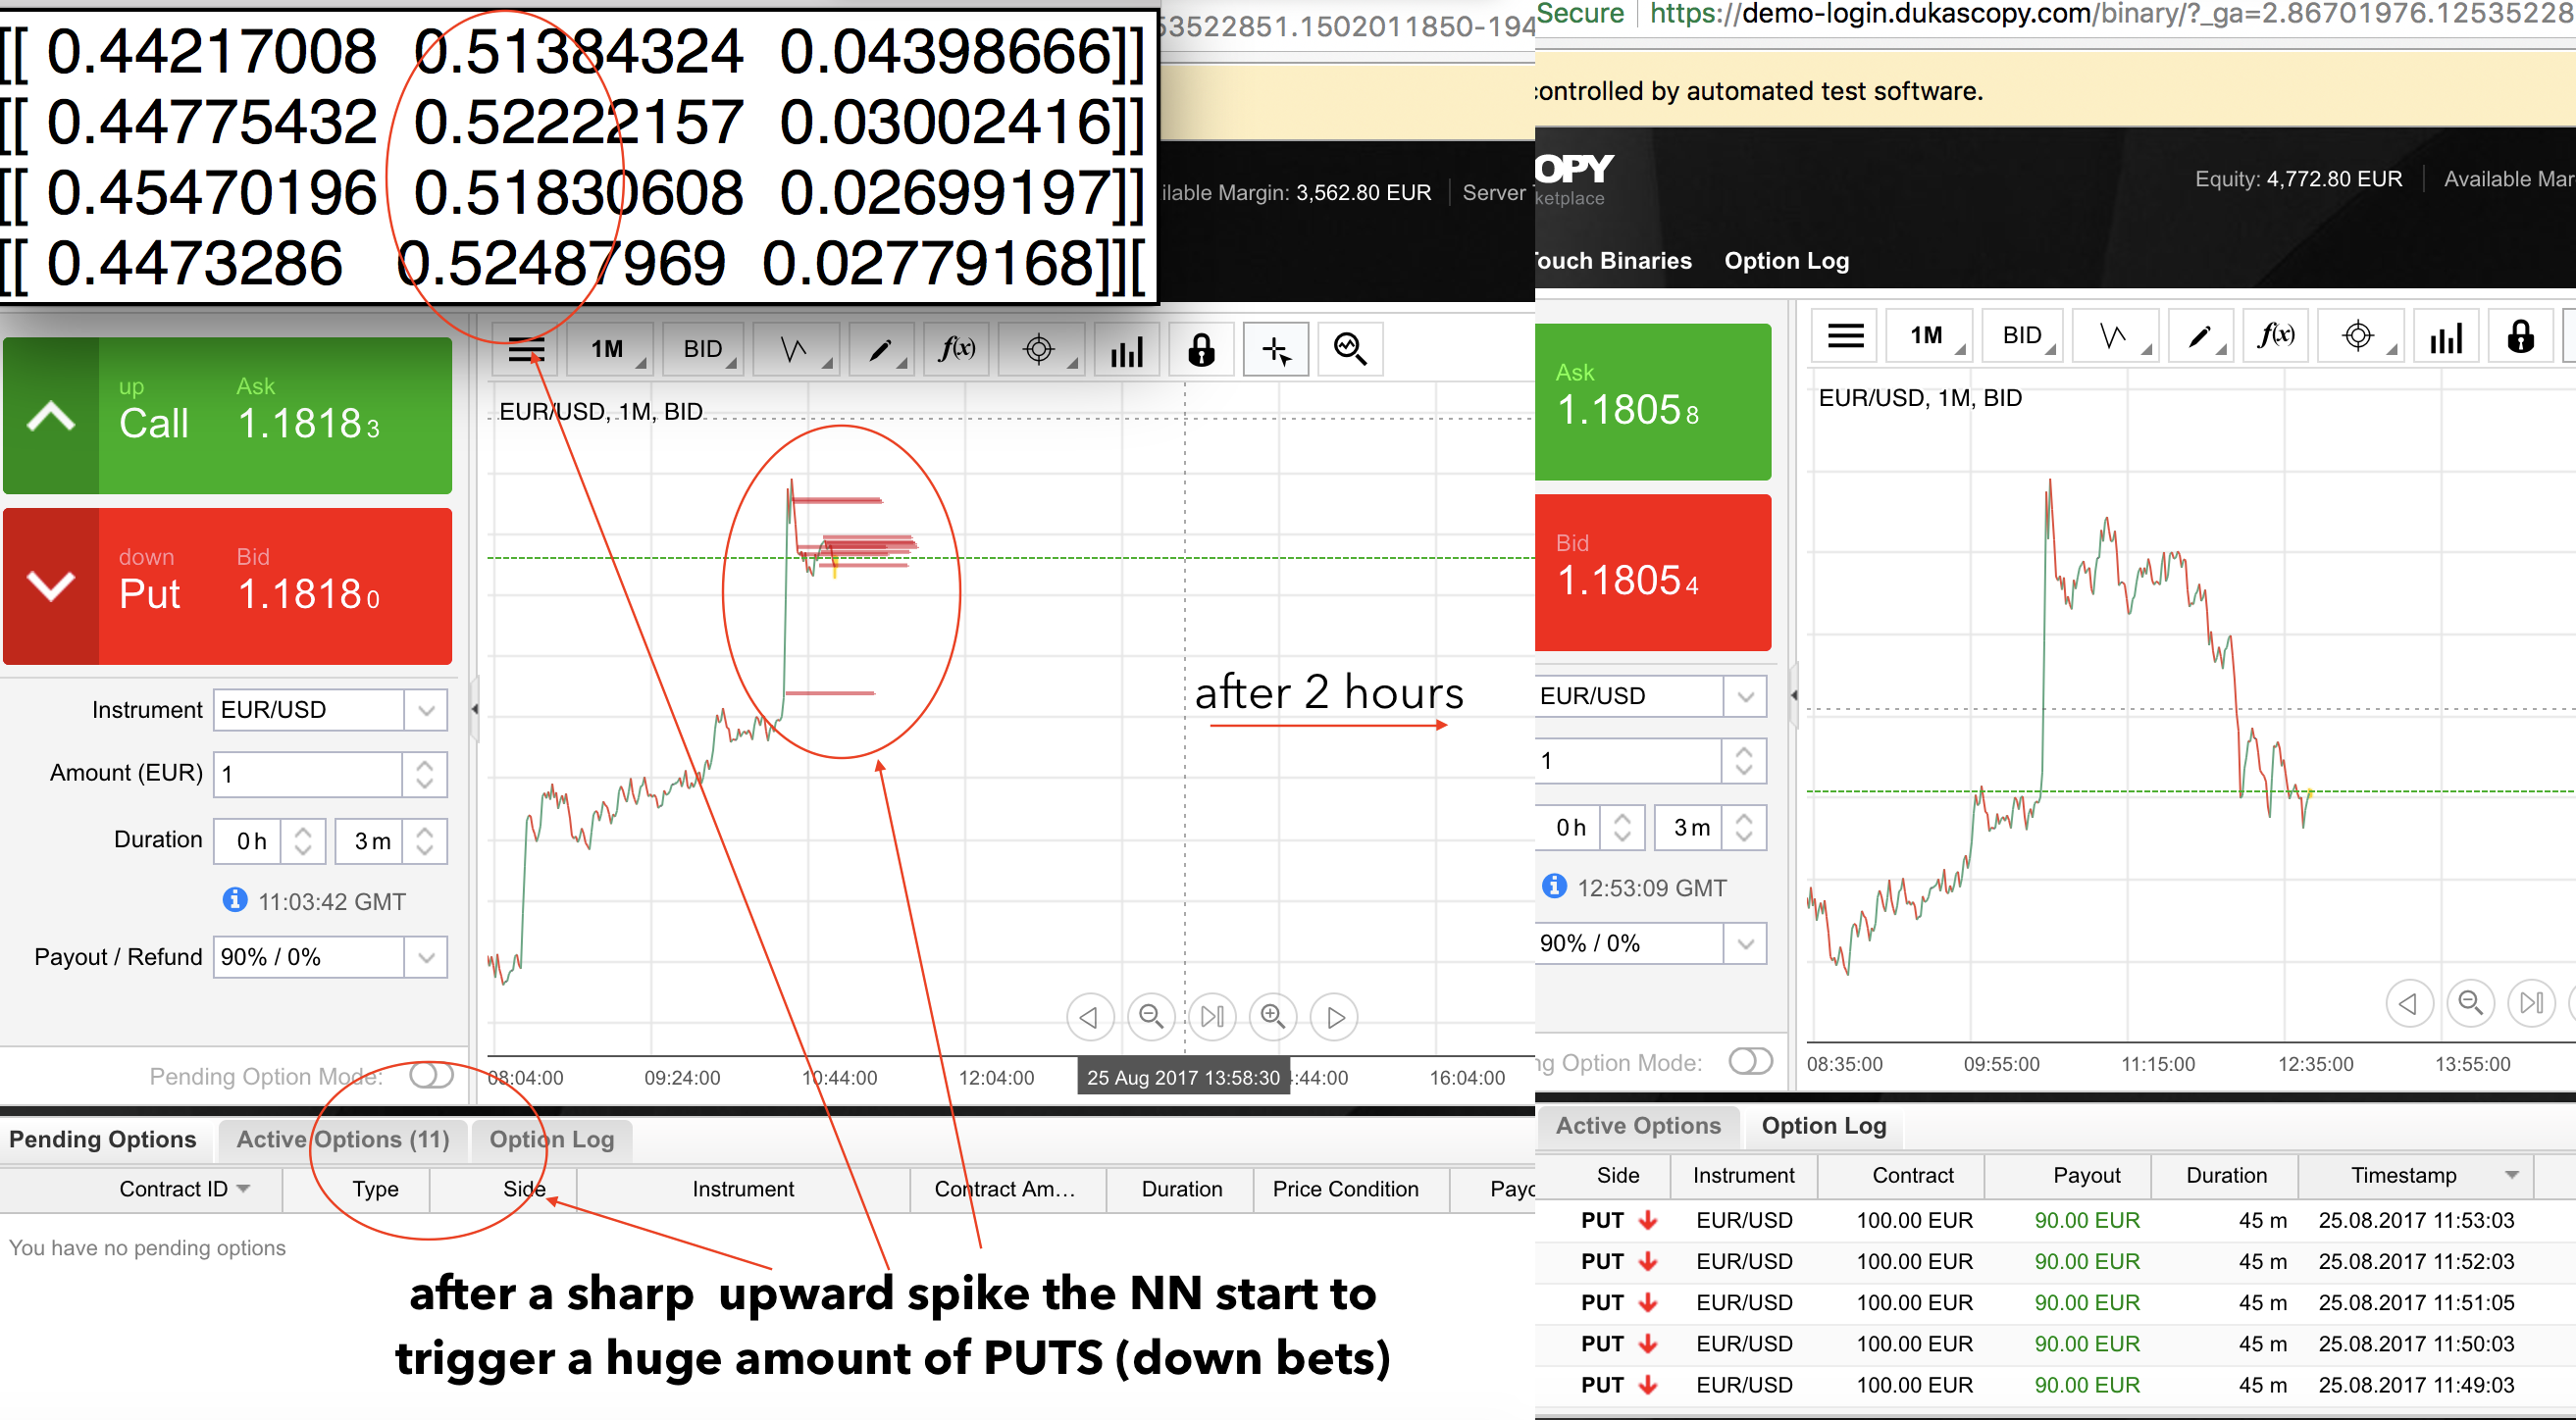
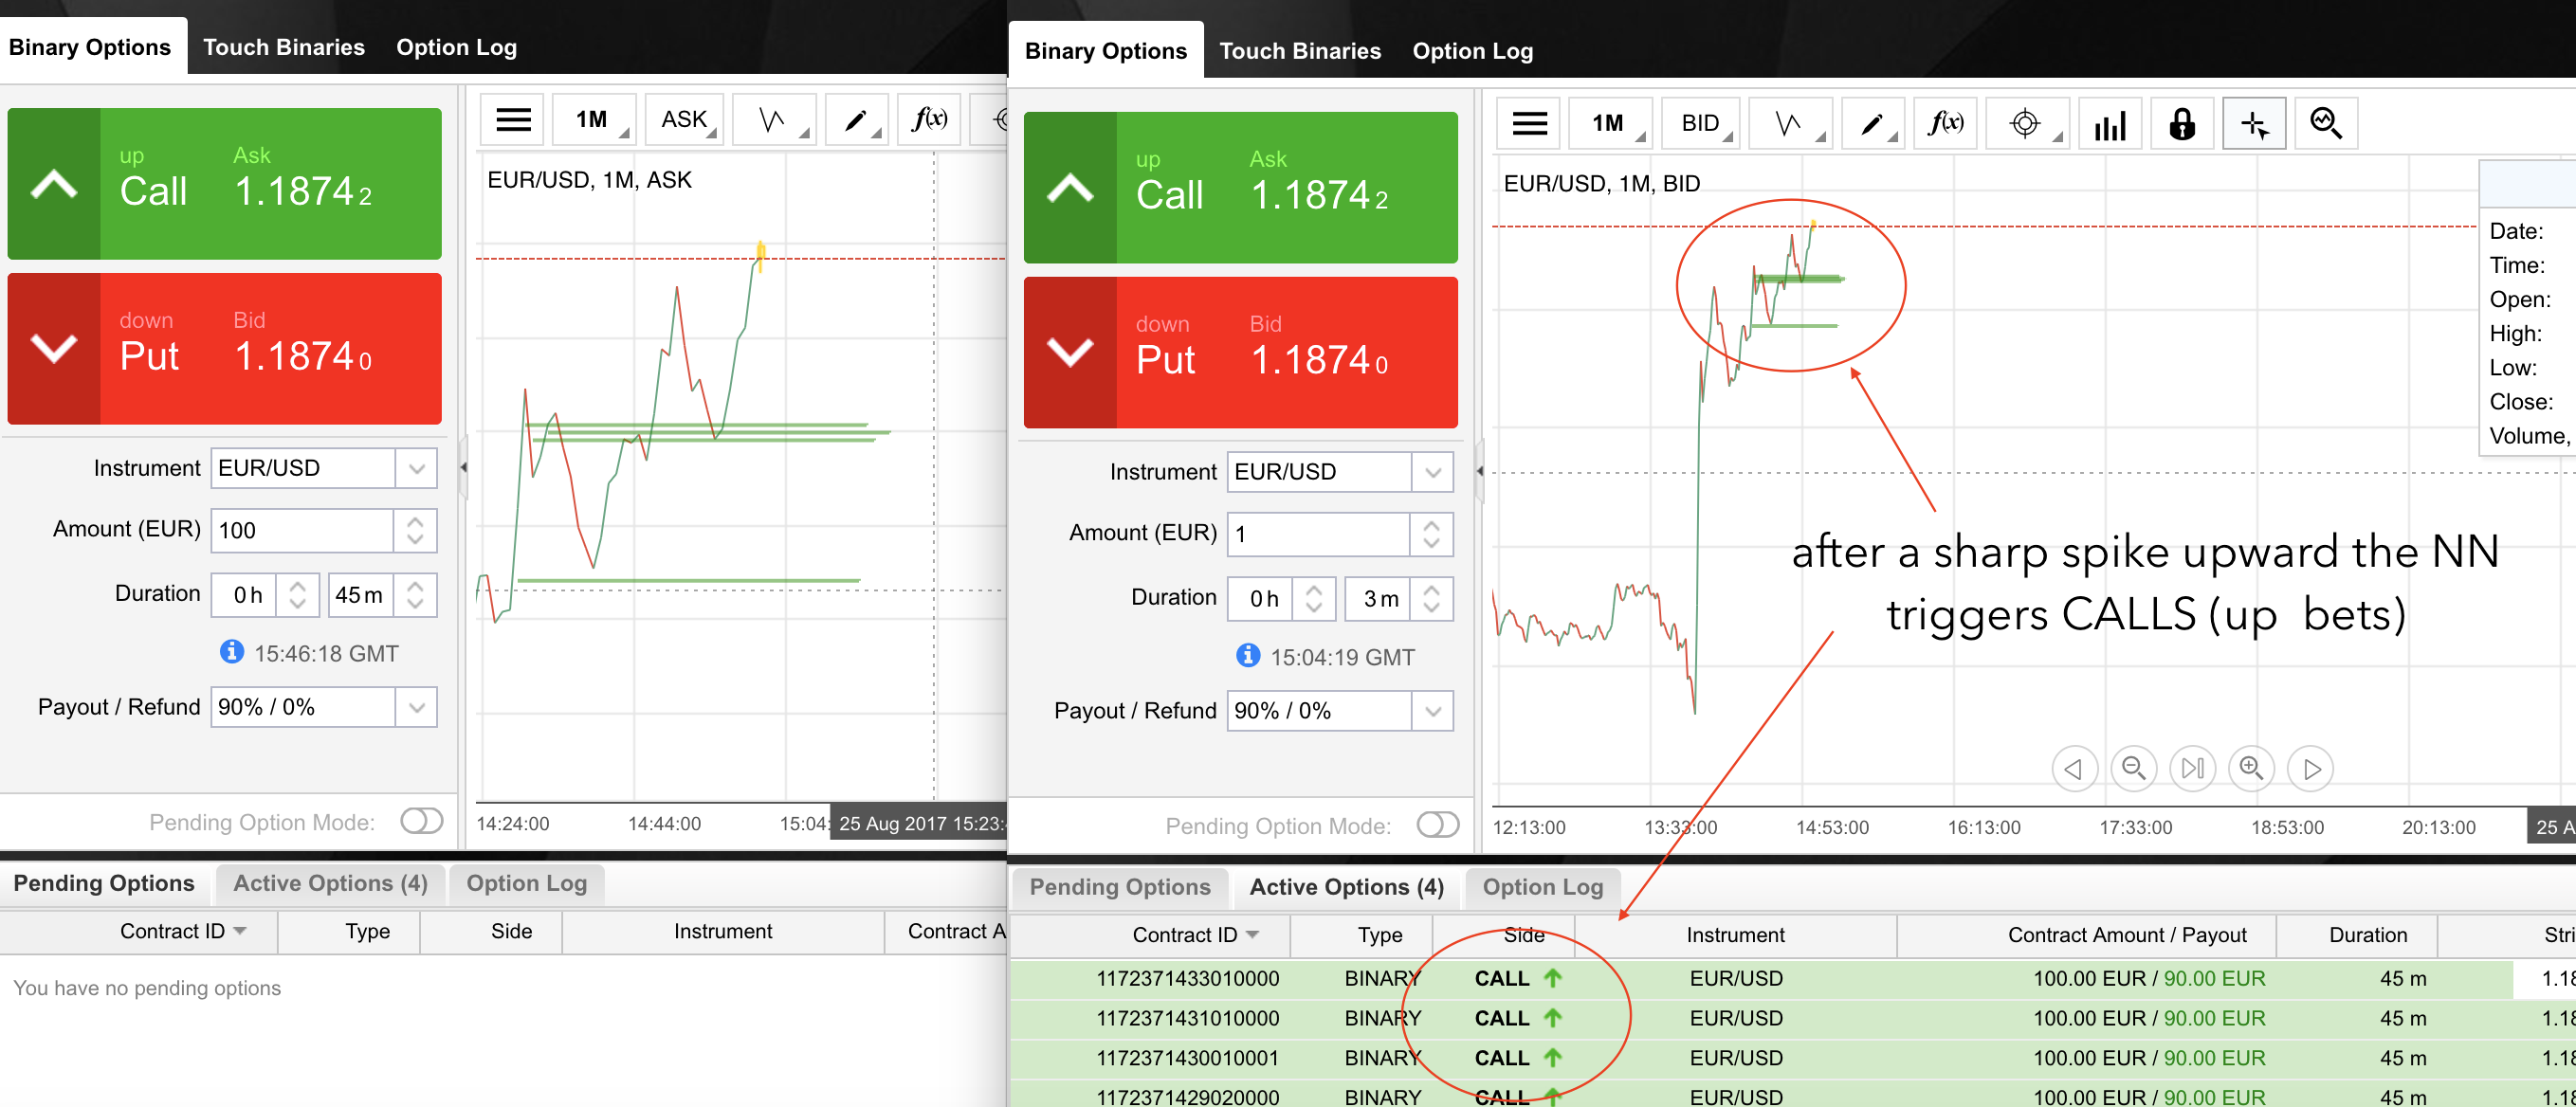
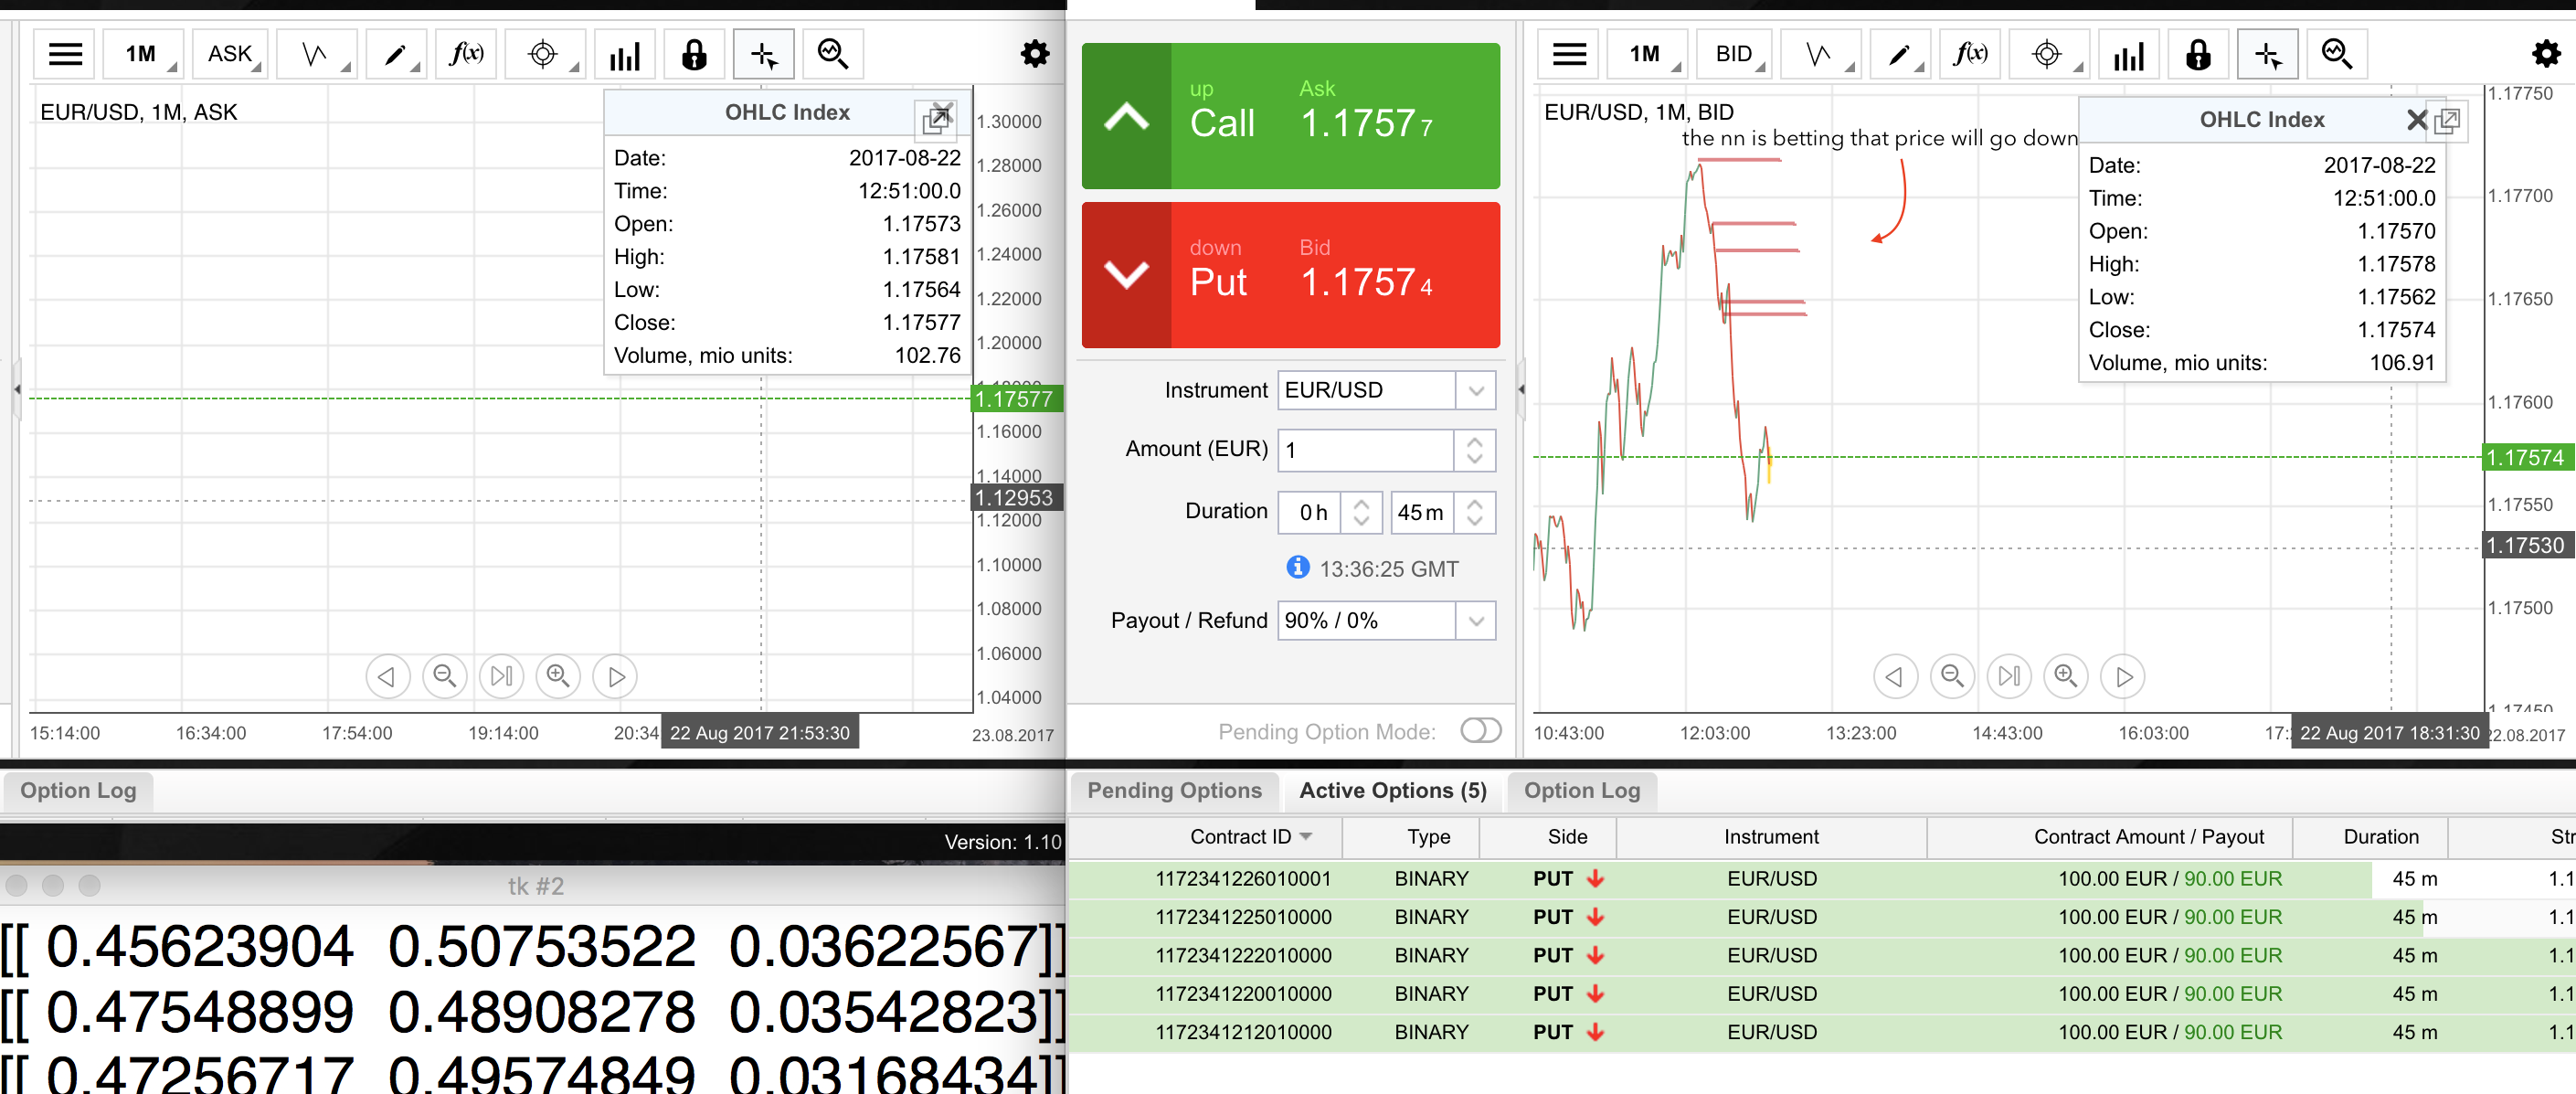
So here we see the case scenario: sharp 1-min upward spike (the EUR/USD is following a stable uptrend in this period). I was watching how the NN is reacting to two very similar upward spikes and we can actually assume that she is using some sort of 'high-level' trading strategy. Same base scenario, different outcome. You can see in the first one she is betting down after the spikes (and is right), and in the second one is betting up (and is also right). Luck? Random? Strategy? Aliens? Illuminati? Who knows. I just know my cash is growing.
Is this a 'shut up and take my money' scenario? It is NOT. As I said betting against the trend is really dangerous and it happened that she was also wrong sometimes. I need to shrink down the prediction size, and I have some great idea for the next version of the framework-v.0.5.0, the GUI version.
- Is time to build a GUI for doing training, I need to do intensive research with different pairs, strategies, and ideas. I need to be able to implement and change testing/training style quickly and also to visualize what I am doing. Is time to build a GUI. I am learning PyQt4, that seems to me the best option.
- What we are asking the NN is TOO difficult, predicting non-stop the market 12 hours a day. The idea I am following is to take a particular event (for instance USA non-farm payroll) and ask the NN to predict the movement of the pairs after the event.
- The time has arrived to take in fresh new data. And I am not speaking only about prices, I am speaking about taking all the bullshit from macro-economic data to weather forecast. If I plan to start to train the NN on more specific tasks/event I need relevant data about that.
I will start working now on my GUI with PyQt4, (even if its 03:00AM). Next update? Dunno yet. Ideally I will update the blog again next week after the new model will be in action. Let's see what will happen. If I disappear is because I became millionare ;)
Day 21 - Portabilty issues and web-app
Note: I am not giving focusing 100% on the project these weeks due to a big competetitive programming competition that will be held in two month, after that I will start again hammering on this proj as I used to.
So the second week of trading ended, my portfolio is positive but I am dissatisfied with the fact that I am still running the algo on my laptop everyday in the office. I need to find a stabler solution. I changed a bit my point of view from last week, I don't wanna do a desktop-app but a web-app, I am playing around with couple of frameworks like Flask and Django and I feel kindof intrigued. But the problem of portability remains: right now I need to control mouse and keyboard to interact with my broker. Ideally this situation (kind of embarassing) will change when I will move to some better quality broker like OANDA or similar, but right now my solution is working fine so I will stick with it for a while. So the web-app is a nice option, for having a GUI for testing/development purposes of my NN, but for the trading side I still need to run my script on a machine. Since running it from my laptop all the time is not so convenient (it takes 1.5h to collect the data for the first 90min window) I need to set up some trading environment at home. I will set up a Linux virtual machine on my PC at home, so that it will run constantly even when I am at the office. This way I will be able to start doing some statistics/risk assesment of the trading strategies.
Last Day of Part One - Results and Future
Start O.T. part: Now is December, and couple of month has passed. In these last period I trained for ACM ICPC regional contest and improved substantially my C++ and Algo skills, at the same time our beloved NN was running from my house even if I was travelling around the world for various bootcamp (you can see in the picture the award ceremony of Moscow ACM ICPC Bootcamp). End O.T. part. What are the results after a couple of month of trading? I decided to publish three different trading sessions that I ran with the NN we discussed up to now. The results were generally positive and you can find them here ( !!!$$$@@ ). The NN behaves as predicted, with a win/loss ratio (70%-80%) even higher then the one calculated two months ago while choosing the hyperparameters. I acutally made some others changes/improvements to the system that I will not discose here, but overall I am kind of satisfied with that. The strategy could now actually be ready to be implemented on a real broker account to trade, and make a solid profit out of it. That was more or less my goal. Will i stop here? Of course I won't. I 'proved' to myself that applying Deep-Learning to financial markets makes sense, and right now, with all the free time available after ICPC, I can start with my amazing reading-list (I will put it at the end of the article) about algo-trading and deep-learning. Why am I not satisfied? I fell my knowledge is still limited and I still have a lot to learn and improve. Come on, did you really thing I would have stopped here? This is only the start of the journey.
brief reading list of book to read (re-read) for my next projs:
Algo Trading:
- (Wiley Trading) Robert Pardo-The Evaluation and Optimization of Trading Strategies-Wiley (2008)
- Barry Johnson-Algorithmic Trading and DMA_ An introduction to direct access trading strategies-4Myeloma Press (2010)
- Irene Aldridge-High-Frequency Trading_ A Practical Guide to Algorithmic Strategies and Trading Systems (Wiley Trading) (2009)
- Quantitative Trading - How to Build Your Own Algorithmic Trading Business
- Robert Kissell (Auth.)-The Science of Algorithmic Trading and Portfolio Management-Academic Press (2013)
Machine Learning/Deep Learning:
Are you still reading? omg I didn't think my stuff would be actually interesting. In this case you must drop by an email giving me some feedback -> alessandro.solbiati@post.com (as a small reward for having read my wild thoughts until here)